Immigrants from Honduras vs Immigrants from St. Vincent and the Grenadines Disability Age 18 to 34
COMPARE
Immigrants from Honduras
Immigrants from St. Vincent and the Grenadines
Disability Age 18 to 34
Disability Age 18 to 34 Comparison
Immigrants from Honduras
Immigrants from St. Vincent and the Grenadines
6.4%
DISABILITY AGE 18 TO 34
87.7/ 100
METRIC RATING
137th/ 347
METRIC RANK
5.5%
DISABILITY AGE 18 TO 34
100.0/ 100
METRIC RATING
12th/ 347
METRIC RANK
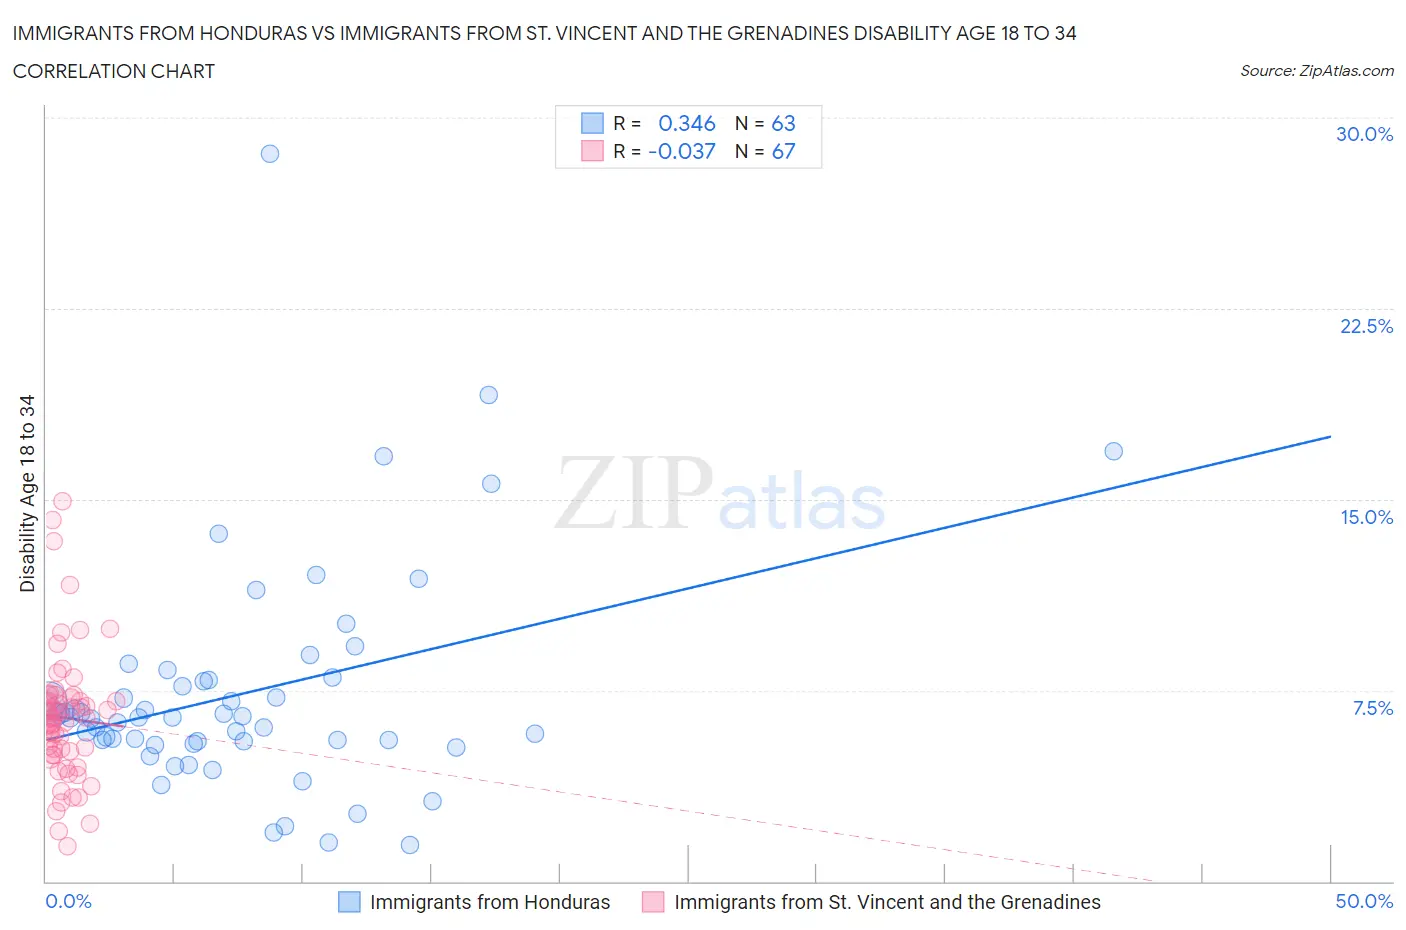
Immigrants from Honduras vs Immigrants from St. Vincent and the Grenadines Disability Age 18 to 34 Correlation Chart
The statistical analysis conducted on geographies consisting of 322,187,149 people shows a mild positive correlation between the proportion of Immigrants from Honduras and percentage of population with a disability between the ages 18 and 35 in the United States with a correlation coefficient (R) of 0.346 and weighted average of 6.4%. Similarly, the statistical analysis conducted on geographies consisting of 56,176,213 people shows no correlation between the proportion of Immigrants from St. Vincent and the Grenadines and percentage of population with a disability between the ages 18 and 35 in the United States with a correlation coefficient (R) of -0.037 and weighted average of 5.5%, a difference of 15.4%.
Disability Age 18 to 34 Correlation Summary
| Measurement | Immigrants from Honduras | Immigrants from St. Vincent and the Grenadines |
| Minimum | 1.4% | 1.4% |
| Maximum | 28.6% | 14.9% |
| Range | 27.2% | 13.6% |
| Mean | 7.4% | 6.4% |
| Median | 6.4% | 6.4% |
| Interquartile 25% (IQ1) | 5.5% | 5.0% |
| Interquartile 75% (IQ3) | 7.9% | 7.2% |
| Interquartile Range (IQR) | 2.4% | 2.2% |
| Standard Deviation (Sample) | 4.4% | 2.6% |
| Standard Deviation (Population) | 4.4% | 2.5% |
Similar Demographics by Disability Age 18 to 34
Demographics Similar to Immigrants from Honduras by Disability Age 18 to 34
In terms of disability age 18 to 34, the demographic groups most similar to Immigrants from Honduras are Spanish American Indian (6.4%, a difference of 0.0%), Immigrants from Belize (6.4%, a difference of 0.050%), Immigrants from Fiji (6.4%, a difference of 0.070%), Immigrants from Sweden (6.4%, a difference of 0.13%), and Palestinian (6.4%, a difference of 0.14%).
| Demographics | Rating | Rank | Disability Age 18 to 34 |
| Immigrants | Dominica | 90.5 /100 | #130 | Exceptional 6.3% |
| Immigrants | Saudi Arabia | 90.4 /100 | #131 | Exceptional 6.3% |
| Guatemalans | 89.6 /100 | #132 | Excellent 6.4% |
| Brazilians | 89.0 /100 | #133 | Excellent 6.4% |
| Immigrants | Europe | 88.8 /100 | #134 | Excellent 6.4% |
| Palestinians | 88.5 /100 | #135 | Excellent 6.4% |
| Immigrants | Sweden | 88.5 /100 | #136 | Excellent 6.4% |
| Immigrants | Honduras | 87.7 /100 | #137 | Excellent 6.4% |
| Spanish American Indians | 87.7 /100 | #138 | Excellent 6.4% |
| Immigrants | Belize | 87.4 /100 | #139 | Excellent 6.4% |
| Immigrants | Fiji | 87.3 /100 | #140 | Excellent 6.4% |
| Jamaicans | 86.8 /100 | #141 | Excellent 6.4% |
| South American Indians | 86.5 /100 | #142 | Excellent 6.4% |
| Immigrants | Latvia | 86.4 /100 | #143 | Excellent 6.4% |
| Albanians | 85.3 /100 | #144 | Excellent 6.4% |
Demographics Similar to Immigrants from St. Vincent and the Grenadines by Disability Age 18 to 34
In terms of disability age 18 to 34, the demographic groups most similar to Immigrants from St. Vincent and the Grenadines are Vietnamese (5.5%, a difference of 0.060%), Immigrants from Uzbekistan (5.5%, a difference of 0.13%), Guyanese (5.5%, a difference of 0.28%), Immigrants from Iran (5.5%, a difference of 0.32%), and Indian (Asian) (5.5%, a difference of 0.47%).
| Demographics | Rating | Rank | Disability Age 18 to 34 |
| Immigrants | Taiwan | 100.0 /100 | #5 | Exceptional 5.4% |
| Filipinos | 100.0 /100 | #6 | Exceptional 5.4% |
| Immigrants | China | 100.0 /100 | #7 | Exceptional 5.4% |
| Immigrants | Guyana | 100.0 /100 | #8 | Exceptional 5.5% |
| Guyanese | 100.0 /100 | #9 | Exceptional 5.5% |
| Immigrants | Uzbekistan | 100.0 /100 | #10 | Exceptional 5.5% |
| Vietnamese | 100.0 /100 | #11 | Exceptional 5.5% |
| Immigrants | St. Vincent and the Grenadines | 100.0 /100 | #12 | Exceptional 5.5% |
| Immigrants | Iran | 100.0 /100 | #13 | Exceptional 5.5% |
| Indians (Asian) | 100.0 /100 | #14 | Exceptional 5.5% |
| Immigrants | India | 100.0 /100 | #15 | Exceptional 5.6% |
| Immigrants | Israel | 100.0 /100 | #16 | Exceptional 5.6% |
| Immigrants | Eastern Asia | 100.0 /100 | #17 | Exceptional 5.6% |
| Immigrants | Bolivia | 100.0 /100 | #18 | Exceptional 5.6% |
| Thais | 100.0 /100 | #19 | Exceptional 5.6% |