Potawatomi vs Immigrants from Philippines Disability Age 35 to 64
COMPARE
Potawatomi
Immigrants from Philippines
Disability Age 35 to 64
Disability Age 35 to 64 Comparison
Potawatomi
Immigrants from Philippines
14.8%
DISABILITY AGE 35 TO 64
0.0/ 100
METRIC RATING
322nd/ 347
METRIC RANK
10.4%
DISABILITY AGE 35 TO 64
98.0/ 100
METRIC RATING
101st/ 347
METRIC RANK
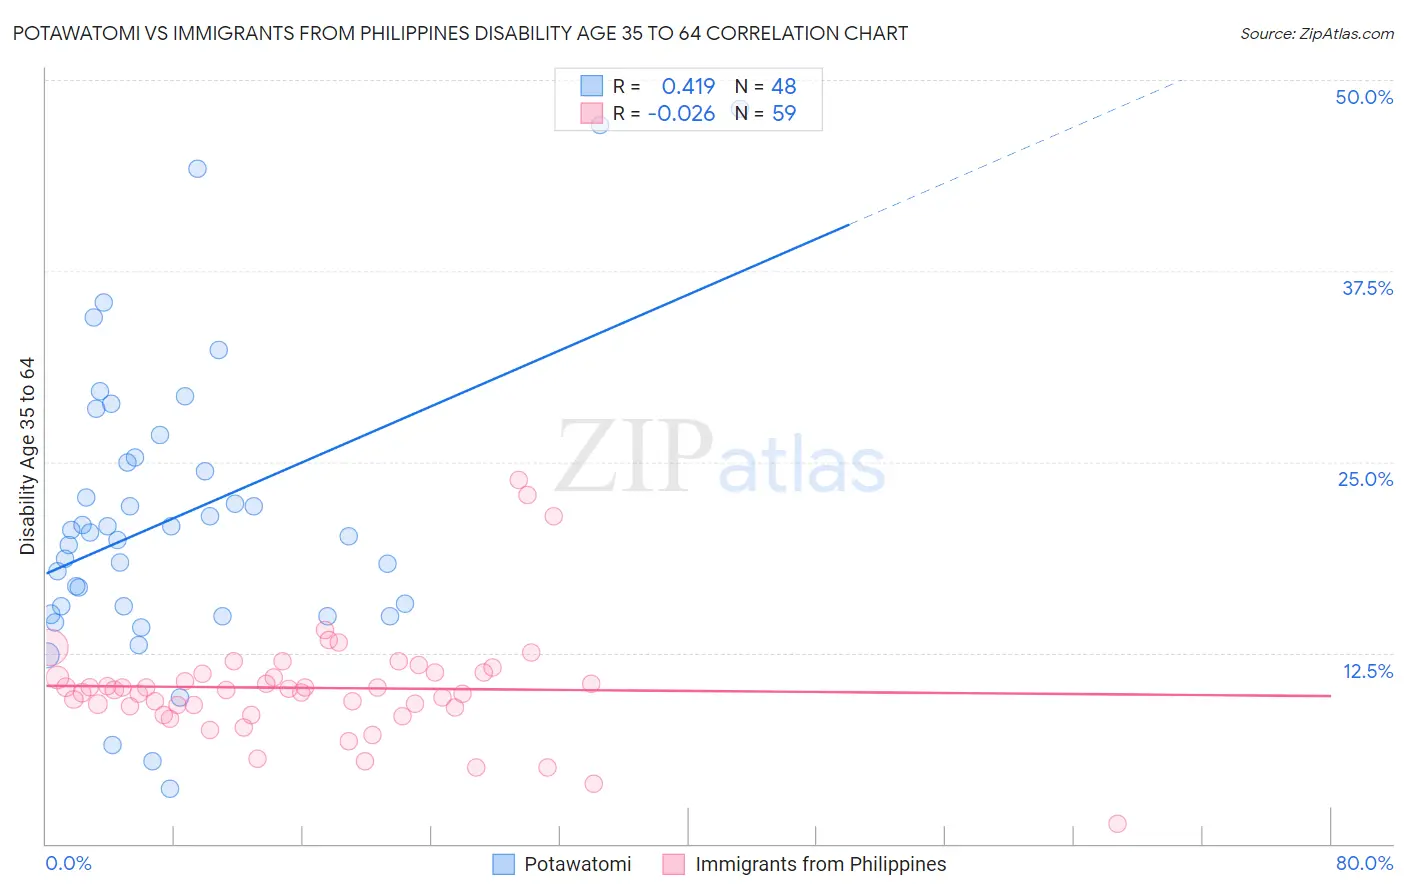
Potawatomi vs Immigrants from Philippines Disability Age 35 to 64 Correlation Chart
The statistical analysis conducted on geographies consisting of 117,756,244 people shows a moderate positive correlation between the proportion of Potawatomi and percentage of population with a disability between the ages 34 and 64 in the United States with a correlation coefficient (R) of 0.419 and weighted average of 14.8%. Similarly, the statistical analysis conducted on geographies consisting of 470,924,996 people shows no correlation between the proportion of Immigrants from Philippines and percentage of population with a disability between the ages 34 and 64 in the United States with a correlation coefficient (R) of -0.026 and weighted average of 10.4%, a difference of 42.0%.
Disability Age 35 to 64 Correlation Summary
| Measurement | Potawatomi | Immigrants from Philippines |
| Minimum | 3.6% | 1.3% |
| Maximum | 48.1% | 23.8% |
| Range | 44.6% | 22.5% |
| Mean | 21.4% | 10.2% |
| Median | 20.2% | 10.1% |
| Interquartile 25% (IQ1) | 15.3% | 8.9% |
| Interquartile 75% (IQ3) | 25.2% | 11.2% |
| Interquartile Range (IQR) | 9.9% | 2.3% |
| Standard Deviation (Sample) | 9.5% | 3.7% |
| Standard Deviation (Population) | 9.4% | 3.7% |
Similar Demographics by Disability Age 35 to 64
Demographics Similar to Potawatomi by Disability Age 35 to 64
In terms of disability age 35 to 64, the demographic groups most similar to Potawatomi are Comanche (14.7%, a difference of 0.040%), Black/African American (14.7%, a difference of 0.30%), Immigrants from Cabo Verde (14.7%, a difference of 0.45%), Ottawa (14.6%, a difference of 0.87%), and Crow (14.6%, a difference of 0.94%).
| Demographics | Rating | Rank | Disability Age 35 to 64 |
| Alaska Natives | 0.0 /100 | #315 | Tragic 14.5% |
| Osage | 0.0 /100 | #316 | Tragic 14.5% |
| Crow | 0.0 /100 | #317 | Tragic 14.6% |
| Ottawa | 0.0 /100 | #318 | Tragic 14.6% |
| Immigrants | Cabo Verde | 0.0 /100 | #319 | Tragic 14.7% |
| Blacks/African Americans | 0.0 /100 | #320 | Tragic 14.7% |
| Comanche | 0.0 /100 | #321 | Tragic 14.7% |
| Potawatomi | 0.0 /100 | #322 | Tragic 14.8% |
| Apache | 0.0 /100 | #323 | Tragic 14.9% |
| Chippewa | 0.0 /100 | #324 | Tragic 15.0% |
| Arapaho | 0.0 /100 | #325 | Tragic 15.1% |
| Natives/Alaskans | 0.0 /100 | #326 | Tragic 15.3% |
| Pueblo | 0.0 /100 | #327 | Tragic 15.3% |
| Cajuns | 0.0 /100 | #328 | Tragic 15.3% |
| Cherokee | 0.0 /100 | #329 | Tragic 15.5% |
Demographics Similar to Immigrants from Philippines by Disability Age 35 to 64
In terms of disability age 35 to 64, the demographic groups most similar to Immigrants from Philippines are Immigrants from Jordan (10.4%, a difference of 0.050%), Immigrants from Western Asia (10.4%, a difference of 0.070%), Immigrants from Ukraine (10.4%, a difference of 0.090%), Immigrants from Austria (10.4%, a difference of 0.23%), and Macedonian (10.4%, a difference of 0.26%).
| Demographics | Rating | Rank | Disability Age 35 to 64 |
| Immigrants | Italy | 98.7 /100 | #94 | Exceptional 10.3% |
| Chinese | 98.7 /100 | #95 | Exceptional 10.3% |
| Immigrants | South Africa | 98.5 /100 | #96 | Exceptional 10.3% |
| Immigrants | Denmark | 98.4 /100 | #97 | Exceptional 10.3% |
| Immigrants | Uruguay | 98.3 /100 | #98 | Exceptional 10.3% |
| Palestinians | 98.2 /100 | #99 | Exceptional 10.4% |
| Immigrants | Jordan | 98.1 /100 | #100 | Exceptional 10.4% |
| Immigrants | Philippines | 98.0 /100 | #101 | Exceptional 10.4% |
| Immigrants | Western Asia | 98.0 /100 | #102 | Exceptional 10.4% |
| Immigrants | Ukraine | 97.9 /100 | #103 | Exceptional 10.4% |
| Immigrants | Austria | 97.8 /100 | #104 | Exceptional 10.4% |
| Macedonians | 97.8 /100 | #105 | Exceptional 10.4% |
| Immigrants | Hungary | 97.6 /100 | #106 | Exceptional 10.4% |
| Zimbabweans | 97.4 /100 | #107 | Exceptional 10.4% |
| Ethiopians | 97.4 /100 | #108 | Exceptional 10.5% |