Norwegian vs Immigrants from Philippines Disability Age 35 to 64

COMPARE

Norwegian
Race
Ancestry
AfghanAfricanAlaska NativeAlaskan AthabascanAlbanianAleutAlsatianAmericanApacheArabArapahoArgentineanArmenianAssyrian/Chaldean/SyriacAustralianAustrianBahamianBangladeshiBarbadianBasqueBelgianBelizeanBermudanBhutaneseBlackfeetBolivianBrazilianBritishBritish West IndianBulgarianBurmeseCajunCambodianCanadianCape VerdeanCarpatho RusynCelticCentral AmericanCentral American IndianCherokeeCheyenneChickasawChileanChineseChippewaChoctawColombianColvilleComancheCosta RicanCreeCreekCroatianCrowCubanCypriotCzechCzechoslovakianDanishDelawareDominicanDutchDutch West IndianEastern EuropeanEcuadorianEgyptianEnglishEstonianEthiopianEuropeanFijianFilipinoFinnishFrenchFrench American IndianFrench CanadianGermanGerman RussianGhanaianGreekGuamanian/ChamorroGuatemalanGuyaneseHaitianHmongHonduranHopiHoumaHungarianIcelanderIndian (Asian)IndonesianInupiatIranianIraqiIrishIroquoisIsraeliItalianJamaicanJapaneseJordanianKenyanKiowaKoreanLaotianLatvianLebaneseLiberianLithuanianLumbeeLuxembourgerMacedonianMalaysianMalteseMarshalleseMenomineeMexicanMexican American IndianMongolianMoroccanNative HawaiianNavajoNepaleseNew ZealanderNicaraguanNigerianNorthern EuropeanNorwegianOkinawanOsageOttawaPaiutePakistaniPalestinianPanamanianParaguayanPennsylvania GermanPeruvianPimaPolishPortuguesePotawatomiPuebloPuerto RicanPuget Sound SalishRomanianRussianSalvadoranSamoanScandinavianScotch-IrishScottishSeminoleSenegaleseSerbianShoshoneSierra LeoneanSiouxSlavicSlovakSloveneSomaliSouth AfricanSouth AmericanSouth American IndianSoviet UnionSpaniardSpanishSpanish AmericanSpanish American IndianSri LankanSubsaharan AfricanSudaneseSwedishSwissSyrianTaiwaneseThaiTlingit-HaidaTohono O'OdhamTonganTrinidadian and TobagonianTsimshianTurkishU.S. Virgin IslanderUgandanUkrainianUruguayanUteVenezuelanVietnameseWelshWest IndianYakamaYaquiYugoslavianYumanYup'ikZimbabwean
Immigration
NonimmigrantsImmigrantsAfghanistanAfricaAlbaniaArgentinaArmeniaAsiaAustraliaAustriaBahamasBangladeshBarbadosBelarusBelgiumBelizeBoliviaBosnia and HerzegovinaBrazilBulgariaBurma/MyanmarCabo VerdeCambodiaCameroonCanadaCaribbeanCentral AmericaChileChinaColombiaCongoCosta RicaCroatiaCubaCzechoslovakiaDenmarkDominicaDominican RepublicEastern AfricaEastern AsiaEastern EuropeEcuadorEgyptEl SalvadorEnglandEritreaEthiopiaEuropeFijiFranceGermanyGhanaGreeceGrenadaGuatemalaGuyanaHaitiHondurasHong KongHungaryIndiaIndonesiaIranIraqIrelandIsraelItalyJamaicaJapanJordanKazakhstanKenyaKoreaKuwaitLaosLatin AmericaLatviaLebanonLiberiaLithuaniaMalaysiaMexicoMicronesiaMiddle AfricaMoldovaMoroccoNepalNetherlandsNicaraguaNigeriaNorth AmericaNorth MacedoniaNorthern AfricaNorthern EuropeNorwayOceaniaPakistanPanamaPeruPolandPortugalRomaniaRussiaSaudi ArabiaScotlandSenegalSerbiaSierra LeoneSingaporeSomaliaSouth AfricaSouth AmericaSouth Central AsiaSouth Eastern AsiaSouthern EuropeSpainSri LankaSt. Vincent and the GrenadinesSudanSwedenSwitzerlandSyriaTaiwanThailandTrinidad and TobagoTurkeyUgandaUkraineUruguayUzbekistanVenezuelaVietnamWest IndiesWestern AfricaWestern AsiaWestern EuropeYemenZaireZimbabweAzores
Immigrants from Philippines
Race
Ancestry
AfghanAfricanAlaska NativeAlaskan AthabascanAlbanianAleutAlsatianAmericanApacheArabArapahoArgentineanArmenianAssyrian/Chaldean/SyriacAustralianAustrianBahamianBangladeshiBarbadianBasqueBelgianBelizeanBermudanBhutaneseBlackfeetBolivianBrazilianBritishBritish West IndianBulgarianBurmeseCajunCambodianCanadianCape VerdeanCarpatho RusynCelticCentral AmericanCentral American IndianCherokeeCheyenneChickasawChileanChineseChippewaChoctawColombianColvilleComancheCosta RicanCreeCreekCroatianCrowCubanCypriotCzechCzechoslovakianDanishDelawareDominicanDutchDutch West IndianEastern EuropeanEcuadorianEgyptianEnglishEstonianEthiopianEuropeanFijianFilipinoFinnishFrenchFrench American IndianFrench CanadianGermanGerman RussianGhanaianGreekGuamanian/ChamorroGuatemalanGuyaneseHaitianHmongHonduranHopiHoumaHungarianIcelanderIndian (Asian)IndonesianInupiatIranianIraqiIrishIroquoisIsraeliItalianJamaicanJapaneseJordanianKenyanKiowaKoreanLaotianLatvianLebaneseLiberianLithuanianLumbeeLuxembourgerMacedonianMalaysianMalteseMarshalleseMenomineeMexicanMexican American IndianMongolianMoroccanNative HawaiianNavajoNepaleseNew ZealanderNicaraguanNigerianNorthern EuropeanOkinawanOsageOttawaPaiutePakistaniPalestinianPanamanianParaguayanPennsylvania GermanPeruvianPimaPolishPortuguesePotawatomiPuebloPuerto RicanPuget Sound SalishRomanianRussianSalvadoranSamoanScandinavianScotch-IrishScottishSeminoleSenegaleseSerbianShoshoneSierra LeoneanSiouxSlavicSlovakSloveneSomaliSouth AfricanSouth AmericanSouth American IndianSoviet UnionSpaniardSpanishSpanish AmericanSpanish American IndianSri LankanSubsaharan AfricanSudaneseSwedishSwissSyrianTaiwaneseThaiTlingit-HaidaTohono O'OdhamTonganTrinidadian and TobagonianTsimshianTurkishU.S. Virgin IslanderUgandanUkrainianUruguayanUteVenezuelanVietnameseWelshWest IndianYakamaYaquiYugoslavianYumanYup'ikZimbabwean
Immigration
NonimmigrantsImmigrantsAfghanistanAfricaAlbaniaArgentinaArmeniaAsiaAustraliaAustriaBahamasBangladeshBarbadosBelarusBelgiumBelizeBoliviaBosnia and HerzegovinaBrazilBulgariaBurma/MyanmarCabo VerdeCambodiaCameroonCanadaCaribbeanCentral AmericaChileChinaColombiaCongoCosta RicaCroatiaCubaCzechoslovakiaDenmarkDominicaDominican RepublicEastern AfricaEastern AsiaEastern EuropeEcuadorEgyptEl SalvadorEnglandEritreaEthiopiaEuropeFijiFranceGermanyGhanaGreeceGrenadaGuatemalaGuyanaHaitiHondurasHong KongHungaryIndiaIndonesiaIranIraqIrelandIsraelItalyJamaicaJapanJordanKazakhstanKenyaKoreaKuwaitLaosLatin AmericaLatviaLebanonLiberiaLithuaniaMalaysiaMexicoMicronesiaMiddle AfricaMoldovaMoroccoNepalNetherlandsNicaraguaNigeriaNorth AmericaNorth MacedoniaNorthern AfricaNorthern EuropeNorwayOceaniaPakistanPanamaPeruPhilippinesPolandPortugalRomaniaRussiaSaudi ArabiaScotlandSenegalSerbiaSierra LeoneSingaporeSomaliaSouth AfricaSouth AmericaSouth Central AsiaSouth Eastern AsiaSouthern EuropeSpainSri LankaSt. Vincent and the GrenadinesSudanSwedenSwitzerlandSyriaTaiwanThailandTrinidad and TobagoTurkeyUgandaUkraineUruguayUzbekistanVenezuelaVietnamWest IndiesWestern AfricaWestern AsiaWestern EuropeYemenZaireZimbabweAzores
Disability Age 35 to 64
Income
Poverty
Unemployment
Labor Participation
Family Structure
Vehicle Availability
Education Level
Disability

Disability Age 35 to 64 Comparison

Norwegians

Immigrants from Philippines

Fair
Exceptional
11.5%
DISABILITY AGE 35 TO 64
29.7/ 100
METRIC RATING
192nd/ 347
METRIC RANK
10.4%
DISABILITY AGE 35 TO 64
98.0/ 100
METRIC RATING
101st/ 347
METRIC RANK

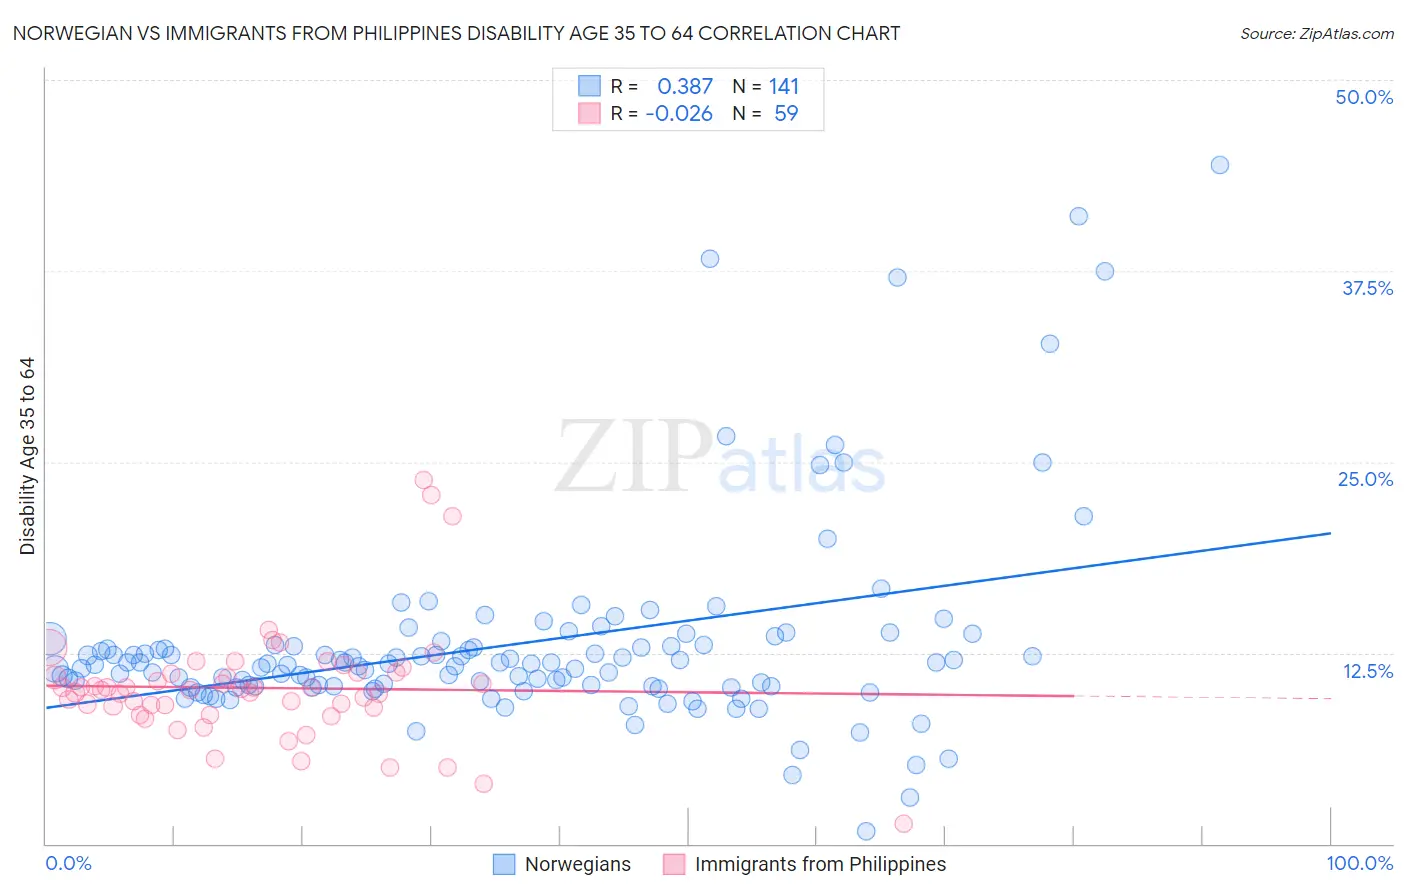
Norwegian vs Immigrants from Philippines Disability Age 35 to 64 Correlation Chart

The statistical analysis conducted on geographies consisting of 532,616,065 people shows a mild positive correlation between the proportion of Norwegians and percentage of population with a disability between the ages 34 and 64 in the United States with a correlation coefficient (R) of 0.387 and weighted average of 11.5%. Similarly, the statistical analysis conducted on geographies consisting of 470,924,996 people shows no correlation between the proportion of Immigrants from Philippines and percentage of population with a disability between the ages 34 and 64 in the United States with a correlation coefficient (R) of -0.026 and weighted average of 10.4%, a difference of 10.4%.
Norwegian vs Immigrants from Philippines Disability Age 35 to 64

Disability Age 35 to 64 Correlation Summary

MeasurementNorwegianImmigrants from Philippines
Minimum0.85%1.3%
Maximum44.4%23.8%
Range43.6%22.5%
Mean13.1%10.2%
Median11.8%10.1%
Interquartile 25% (IQ1)10.3%8.9%
Interquartile 75% (IQ3)13.0%11.2%
Interquartile Range (IQR)2.7%2.3%
Standard Deviation (Sample)6.6%3.7%
Standard Deviation (Population)6.5%3.7%

Similar Demographics by Disability Age 35 to 64

Demographics Similar to Norwegians by Disability Age 35 to 64

In terms of disability age 35 to 64, the demographic groups most similar to Norwegians are Immigrants from Africa (11.5%, a difference of 0.060%), Swedish (11.4%, a difference of 0.15%), Immigrants from Latin America (11.5%, a difference of 0.21%), Immigrants from Nigeria (11.4%, a difference of 0.26%), and Carpatho Rusyn (11.5%, a difference of 0.43%).
DemographicsRating | RankDisability Age 35 to 64
Danes
36.8
/100
|
#185
Fair
11.4%
Slovenes
36.6
/100
|
#186
Fair
11.4%
Immigrants | Bosnia and Herzegovina
35.2
/100
|
#187
Fair
11.4%
Northern Europeans
34.9
/100
|
#188
Fair
11.4%
Hungarians
34.6
/100
|
#189
Fair
11.4%
Immigrants | Nigeria
32.5
/100
|
#190
Fair
11.4%
Swedes
31.3
/100
|
#191
Fair
11.4%
Norwegians
29.7
/100
|
#192
Fair
11.5%
Immigrants | Africa
29.0
/100
|
#193
Fair
11.5%
Immigrants | Latin America
27.5
/100
|
#194
Fair
11.5%
Carpatho Rusyns
25.3
/100
|
#195
Fair
11.5%
Iraqis
24.2
/100
|
#196
Fair
11.5%
Immigrants | Iraq
21.0
/100
|
#197
Fair
11.6%
Immigrants | Panama
20.4
/100
|
#198
Fair
11.6%
Basques
19.5
/100
|
#199
Poor
11.6%

Demographics Similar to Immigrants from Philippines by Disability Age 35 to 64

In terms of disability age 35 to 64, the demographic groups most similar to Immigrants from Philippines are Immigrants from Jordan (10.4%, a difference of 0.050%), Immigrants from Western Asia (10.4%, a difference of 0.070%), Immigrants from Ukraine (10.4%, a difference of 0.090%), Immigrants from Austria (10.4%, a difference of 0.23%), and Macedonian (10.4%, a difference of 0.26%).
DemographicsRating | RankDisability Age 35 to 64
Immigrants | Italy
98.7
/100
|
#94
Exceptional
10.3%
Chinese
98.7
/100
|
#95
Exceptional
10.3%
Immigrants | South Africa
98.5
/100
|
#96
Exceptional
10.3%
Immigrants | Denmark
98.4
/100
|
#97
Exceptional
10.3%
Immigrants | Uruguay
98.3
/100
|
#98
Exceptional
10.3%
Palestinians
98.2
/100
|
#99
Exceptional
10.4%
Immigrants | Jordan
98.1
/100
|
#100
Exceptional
10.4%
Immigrants | Philippines
98.0
/100
|
#101
Exceptional
10.4%
Immigrants | Western Asia
98.0
/100
|
#102
Exceptional
10.4%
Immigrants | Ukraine
97.9
/100
|
#103
Exceptional
10.4%
Immigrants | Austria
97.8
/100
|
#104
Exceptional
10.4%
Macedonians
97.8
/100
|
#105
Exceptional
10.4%
Immigrants | Hungary
97.6
/100
|
#106
Exceptional
10.4%
Zimbabweans
97.4
/100
|
#107
Exceptional
10.4%
Ethiopians
97.4
/100
|
#108
Exceptional
10.5%