Immigrants from Germany vs Cambodian Cognitive Disability
COMPARE
Immigrants from Germany
Cambodian
Cognitive Disability
Cognitive Disability Comparison
Immigrants from Germany
Cambodians
17.0%
COGNITIVE DISABILITY
92.1/ 100
METRIC RATING
131st/ 347
METRIC RANK
17.3%
COGNITIVE DISABILITY
35.9/ 100
METRIC RATING
186th/ 347
METRIC RANK
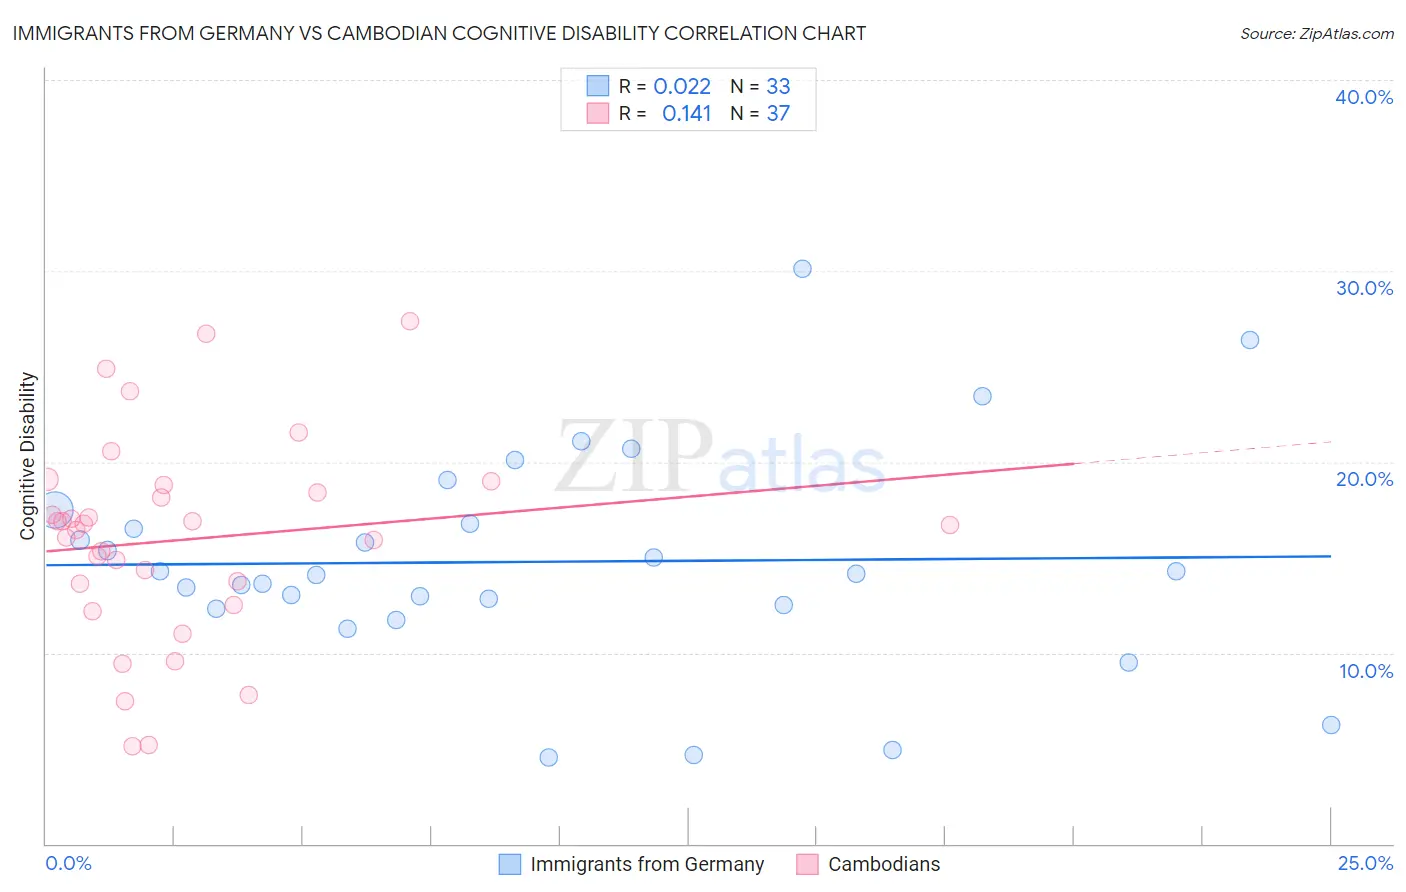
Immigrants from Germany vs Cambodian Cognitive Disability Correlation Chart
The statistical analysis conducted on geographies consisting of 463,867,197 people shows no correlation between the proportion of Immigrants from Germany and percentage of population with cognitive disability in the United States with a correlation coefficient (R) of 0.022 and weighted average of 17.0%. Similarly, the statistical analysis conducted on geographies consisting of 102,506,986 people shows a poor positive correlation between the proportion of Cambodians and percentage of population with cognitive disability in the United States with a correlation coefficient (R) of 0.141 and weighted average of 17.3%, a difference of 2.2%.
Cognitive Disability Correlation Summary
| Measurement | Immigrants from Germany | Cambodian |
| Minimum | 4.5% | 5.1% |
| Maximum | 30.1% | 27.4% |
| Range | 25.7% | 22.2% |
| Mean | 14.8% | 15.9% |
| Median | 14.1% | 16.7% |
| Interquartile 25% (IQ1) | 12.4% | 13.1% |
| Interquartile 75% (IQ3) | 17.1% | 18.6% |
| Interquartile Range (IQR) | 4.7% | 5.5% |
| Standard Deviation (Sample) | 5.7% | 5.3% |
| Standard Deviation (Population) | 5.6% | 5.2% |
Similar Demographics by Cognitive Disability
Demographics Similar to Immigrants from Germany by Cognitive Disability
In terms of cognitive disability, the demographic groups most similar to Immigrants from Germany are White/Caucasian (17.0%, a difference of 0.0%), Immigrants from Vietnam (17.0%, a difference of 0.020%), Immigrants from Jordan (17.0%, a difference of 0.030%), Immigrants from Chile (17.0%, a difference of 0.040%), and Immigrants from Uruguay (17.0%, a difference of 0.080%).
| Demographics | Rating | Rank | Cognitive Disability |
| Turks | 94.5 /100 | #124 | Exceptional 16.9% |
| Scandinavians | 94.1 /100 | #125 | Exceptional 16.9% |
| Europeans | 93.4 /100 | #126 | Exceptional 17.0% |
| Immigrants | Costa Rica | 93.1 /100 | #127 | Exceptional 17.0% |
| Nicaraguans | 93.0 /100 | #128 | Exceptional 17.0% |
| Immigrants | Uruguay | 92.9 /100 | #129 | Exceptional 17.0% |
| Immigrants | Vietnam | 92.4 /100 | #130 | Exceptional 17.0% |
| Immigrants | Germany | 92.1 /100 | #131 | Exceptional 17.0% |
| Whites/Caucasians | 92.1 /100 | #132 | Exceptional 17.0% |
| Immigrants | Jordan | 91.9 /100 | #133 | Exceptional 17.0% |
| Immigrants | Chile | 91.7 /100 | #134 | Exceptional 17.0% |
| Lebanese | 91.3 /100 | #135 | Exceptional 17.0% |
| Israelis | 91.0 /100 | #136 | Exceptional 17.0% |
| Immigrants | Norway | 90.9 /100 | #137 | Exceptional 17.0% |
| Welsh | 90.8 /100 | #138 | Exceptional 17.0% |
Demographics Similar to Cambodians by Cognitive Disability
In terms of cognitive disability, the demographic groups most similar to Cambodians are Afghan (17.3%, a difference of 0.070%), Immigrants from Fiji (17.4%, a difference of 0.070%), Crow (17.3%, a difference of 0.10%), Spaniard (17.3%, a difference of 0.13%), and Immigrants from France (17.4%, a difference of 0.20%).
| Demographics | Rating | Rank | Cognitive Disability |
| Sioux | 48.6 /100 | #179 | Average 17.3% |
| Pakistanis | 43.9 /100 | #180 | Average 17.3% |
| Immigrants | Guyana | 42.9 /100 | #181 | Average 17.3% |
| Arabs | 42.8 /100 | #182 | Average 17.3% |
| Spaniards | 40.3 /100 | #183 | Average 17.3% |
| Crow | 39.1 /100 | #184 | Fair 17.3% |
| Afghans | 38.2 /100 | #185 | Fair 17.3% |
| Cambodians | 35.9 /100 | #186 | Fair 17.3% |
| Immigrants | Fiji | 33.7 /100 | #187 | Fair 17.4% |
| Immigrants | France | 29.8 /100 | #188 | Fair 17.4% |
| Immigrants | Western Asia | 29.5 /100 | #189 | Fair 17.4% |
| Immigrants | Spain | 27.7 /100 | #190 | Fair 17.4% |
| Immigrants | Nonimmigrants | 27.4 /100 | #191 | Fair 17.4% |
| Immigrants | Haiti | 27.1 /100 | #192 | Fair 17.4% |
| Delaware | 25.6 /100 | #193 | Fair 17.4% |