Immigrants from Liberia vs Immigrants from Vietnam Disability Age 35 to 64
COMPARE
Immigrants from Liberia
Immigrants from Vietnam
Disability Age 35 to 64
Disability Age 35 to 64 Comparison
Immigrants from Liberia
Immigrants from Vietnam
13.2%
DISABILITY AGE 35 TO 64
0.0/ 100
METRIC RATING
290th/ 347
METRIC RANK
10.1%
DISABILITY AGE 35 TO 64
99.3/ 100
METRIC RATING
79th/ 347
METRIC RANK
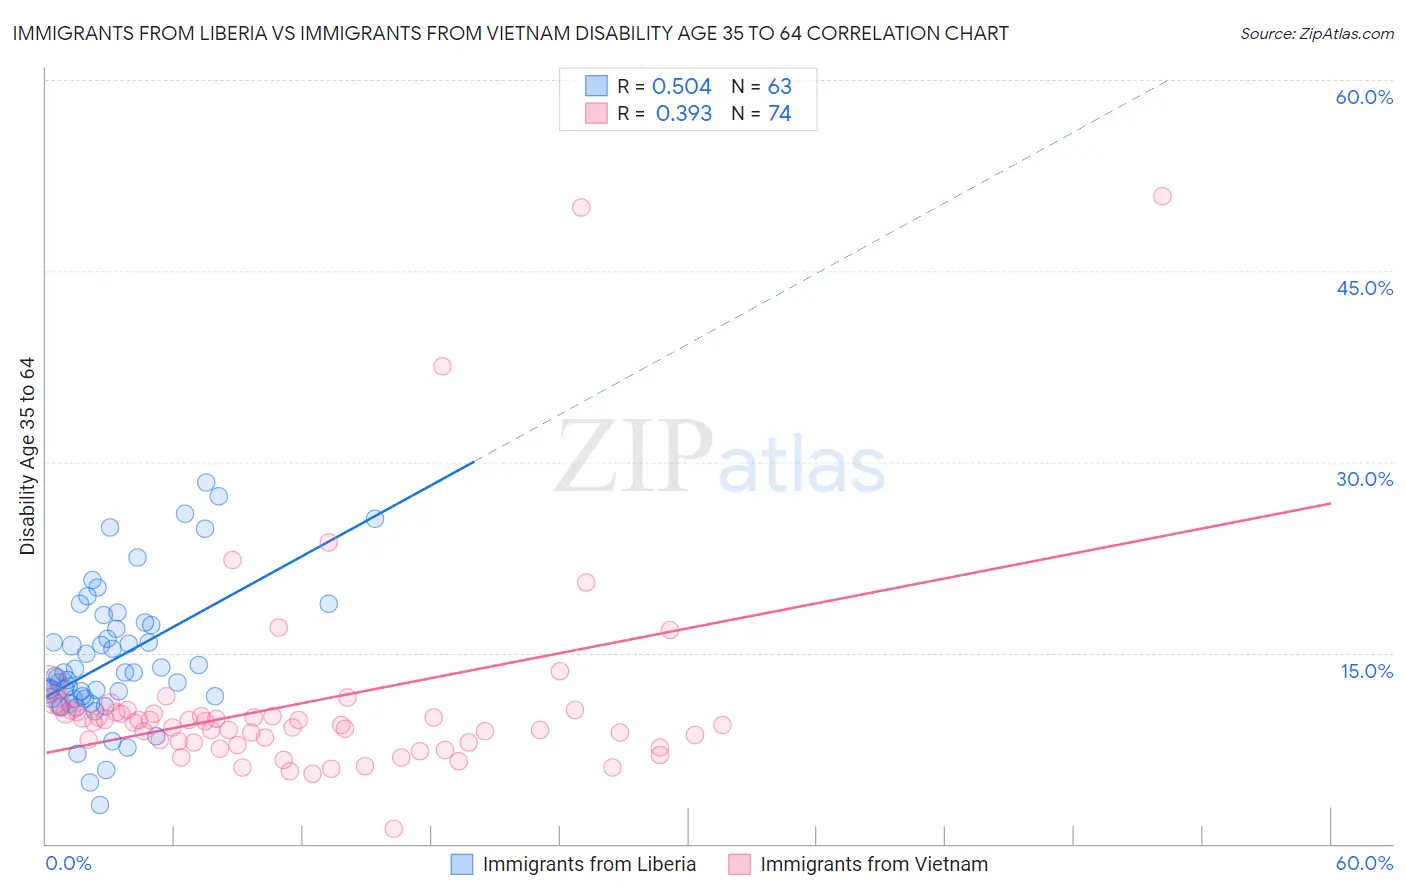
Immigrants from Liberia vs Immigrants from Vietnam Disability Age 35 to 64 Correlation Chart
The statistical analysis conducted on geographies consisting of 135,244,106 people shows a substantial positive correlation between the proportion of Immigrants from Liberia and percentage of population with a disability between the ages 34 and 64 in the United States with a correlation coefficient (R) of 0.504 and weighted average of 13.2%. Similarly, the statistical analysis conducted on geographies consisting of 404,532,897 people shows a mild positive correlation between the proportion of Immigrants from Vietnam and percentage of population with a disability between the ages 34 and 64 in the United States with a correlation coefficient (R) of 0.393 and weighted average of 10.1%, a difference of 30.5%.
Disability Age 35 to 64 Correlation Summary
| Measurement | Immigrants from Liberia | Immigrants from Vietnam |
| Minimum | 3.1% | 1.1% |
| Maximum | 28.4% | 50.9% |
| Range | 25.3% | 49.8% |
| Mean | 14.5% | 11.1% |
| Median | 13.1% | 9.5% |
| Interquartile 25% (IQ1) | 11.4% | 8.0% |
| Interquartile 75% (IQ3) | 17.2% | 10.3% |
| Interquartile Range (IQR) | 5.8% | 2.4% |
| Standard Deviation (Sample) | 5.3% | 8.1% |
| Standard Deviation (Population) | 5.3% | 8.1% |
Similar Demographics by Disability Age 35 to 64
Demographics Similar to Immigrants from Liberia by Disability Age 35 to 64
In terms of disability age 35 to 64, the demographic groups most similar to Immigrants from Liberia are Indonesian (13.2%, a difference of 0.080%), Fijian (13.2%, a difference of 0.15%), Tlingit-Haida (13.2%, a difference of 0.50%), Immigrants from Congo (13.3%, a difference of 0.51%), and Puget Sound Salish (13.3%, a difference of 0.56%).
| Demographics | Rating | Rank | Disability Age 35 to 64 |
| Central American Indians | 0.0 /100 | #283 | Tragic 13.0% |
| Immigrants | Nonimmigrants | 0.0 /100 | #284 | Tragic 13.0% |
| Immigrants | Somalia | 0.0 /100 | #285 | Tragic 13.1% |
| Hmong | 0.0 /100 | #286 | Tragic 13.1% |
| Tlingit-Haida | 0.0 /100 | #287 | Tragic 13.2% |
| Fijians | 0.0 /100 | #288 | Tragic 13.2% |
| Indonesians | 0.0 /100 | #289 | Tragic 13.2% |
| Immigrants | Liberia | 0.0 /100 | #290 | Tragic 13.2% |
| Immigrants | Congo | 0.0 /100 | #291 | Tragic 13.3% |
| Puget Sound Salish | 0.0 /100 | #292 | Tragic 13.3% |
| Ute | 0.0 /100 | #293 | Tragic 13.4% |
| Yaqui | 0.0 /100 | #294 | Tragic 13.5% |
| Yakama | 0.0 /100 | #295 | Tragic 13.6% |
| Africans | 0.0 /100 | #296 | Tragic 13.6% |
| Bangladeshis | 0.0 /100 | #297 | Tragic 13.6% |
Demographics Similar to Immigrants from Vietnam by Disability Age 35 to 64
In terms of disability age 35 to 64, the demographic groups most similar to Immigrants from Vietnam are Jordanian (10.1%, a difference of 0.070%), Immigrants from Croatia (10.2%, a difference of 0.13%), Mongolian (10.1%, a difference of 0.21%), Latvian (10.2%, a difference of 0.23%), and Immigrants from Chile (10.1%, a difference of 0.25%).
| Demographics | Rating | Rank | Disability Age 35 to 64 |
| Immigrants | Northern Europe | 99.5 /100 | #72 | Exceptional 10.1% |
| Immigrants | France | 99.5 /100 | #73 | Exceptional 10.1% |
| Laotians | 99.4 /100 | #74 | Exceptional 10.1% |
| Immigrants | Latvia | 99.4 /100 | #75 | Exceptional 10.1% |
| Immigrants | Chile | 99.4 /100 | #76 | Exceptional 10.1% |
| Mongolians | 99.4 /100 | #77 | Exceptional 10.1% |
| Jordanians | 99.3 /100 | #78 | Exceptional 10.1% |
| Immigrants | Vietnam | 99.3 /100 | #79 | Exceptional 10.1% |
| Immigrants | Croatia | 99.3 /100 | #80 | Exceptional 10.2% |
| Latvians | 99.2 /100 | #81 | Exceptional 10.2% |
| Russians | 99.2 /100 | #82 | Exceptional 10.2% |
| Immigrants | Brazil | 99.2 /100 | #83 | Exceptional 10.2% |
| Sri Lankans | 99.2 /100 | #84 | Exceptional 10.2% |
| Immigrants | Kuwait | 99.1 /100 | #85 | Exceptional 10.2% |
| Immigrants | Europe | 99.1 /100 | #86 | Exceptional 10.2% |