Pakistani vs Aleut Disability
COMPARE
Pakistani
Aleut
Disability
Disability Comparison
Pakistanis
Aleuts
11.7%
DISABILITY
54.7/ 100
METRIC RATING
166th/ 347
METRIC RANK
13.1%
DISABILITY
0.0/ 100
METRIC RATING
292nd/ 347
METRIC RANK
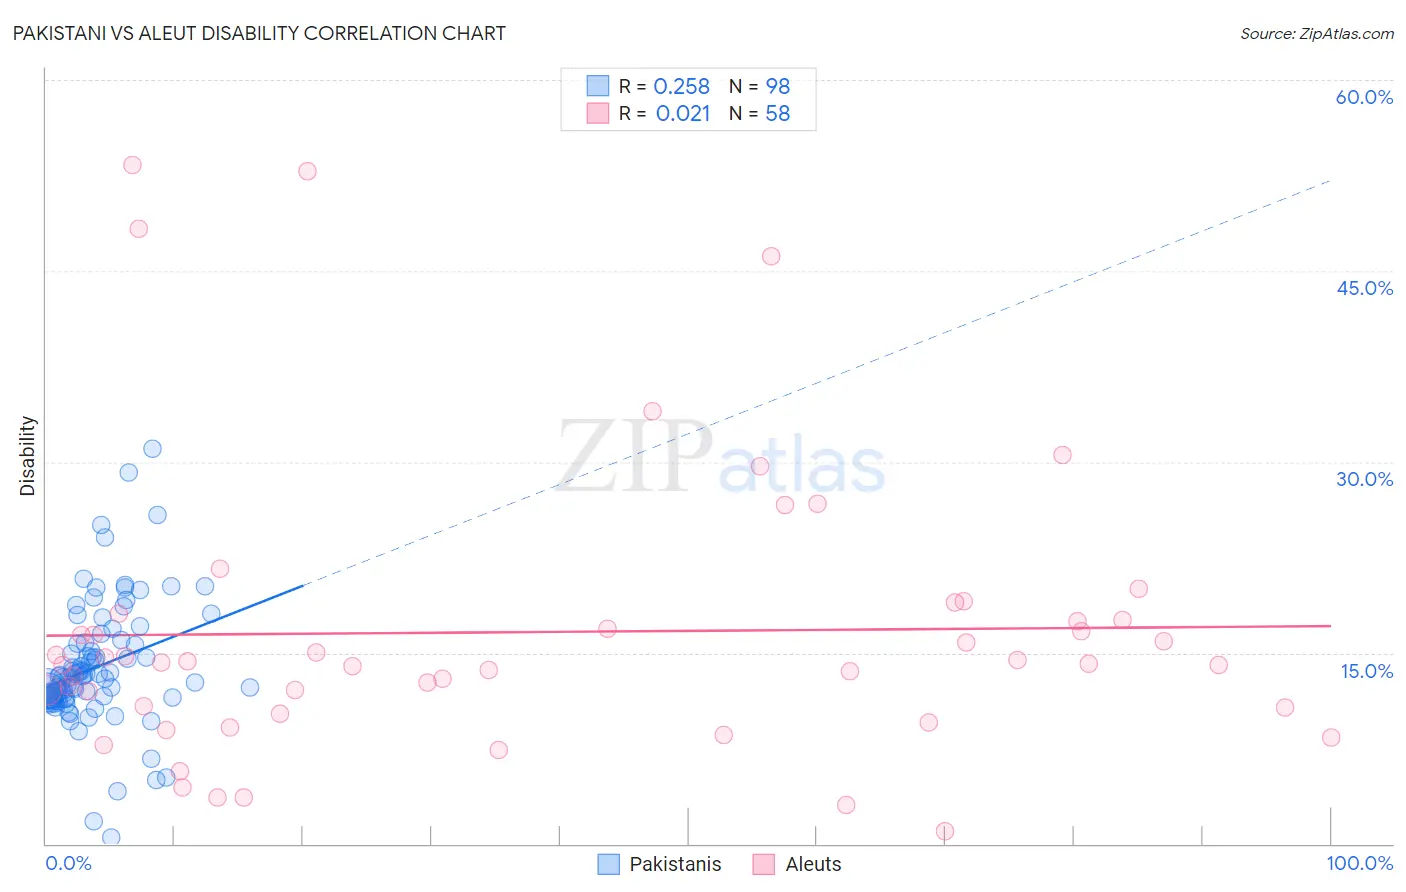
Pakistani vs Aleut Disability Correlation Chart
The statistical analysis conducted on geographies consisting of 335,302,131 people shows a weak positive correlation between the proportion of Pakistanis and percentage of population with a disability in the United States with a correlation coefficient (R) of 0.258 and weighted average of 11.7%. Similarly, the statistical analysis conducted on geographies consisting of 61,782,940 people shows no correlation between the proportion of Aleuts and percentage of population with a disability in the United States with a correlation coefficient (R) of 0.021 and weighted average of 13.1%, a difference of 12.2%.
Disability Correlation Summary
| Measurement | Pakistani | Aleut |
| Minimum | 0.46% | 0.97% |
| Maximum | 31.1% | 53.3% |
| Range | 30.6% | 52.4% |
| Mean | 13.9% | 16.6% |
| Median | 13.1% | 14.2% |
| Interquartile 25% (IQ1) | 11.5% | 10.7% |
| Interquartile 75% (IQ3) | 15.7% | 17.6% |
| Interquartile Range (IQR) | 4.2% | 6.9% |
| Standard Deviation (Sample) | 4.9% | 11.3% |
| Standard Deviation (Population) | 4.8% | 11.2% |
Similar Demographics by Disability
Demographics Similar to Pakistanis by Disability
In terms of disability, the demographic groups most similar to Pakistanis are Estonian (11.7%, a difference of 0.010%), Immigrants from Latin America (11.7%, a difference of 0.030%), Immigrants from Austria (11.7%, a difference of 0.060%), Immigrants from Albania (11.7%, a difference of 0.080%), and Cuban (11.7%, a difference of 0.090%).
| Demographics | Rating | Rank | Disability |
| Guatemalans | 65.1 /100 | #159 | Good 11.6% |
| Immigrants | Barbados | 64.2 /100 | #160 | Good 11.6% |
| Immigrants | Cuba | 62.8 /100 | #161 | Good 11.6% |
| Immigrants | Haiti | 59.2 /100 | #162 | Average 11.7% |
| Immigrants | Trinidad and Tobago | 58.9 /100 | #163 | Average 11.7% |
| Syrians | 58.5 /100 | #164 | Average 11.7% |
| Cubans | 56.7 /100 | #165 | Average 11.7% |
| Pakistanis | 54.7 /100 | #166 | Average 11.7% |
| Estonians | 54.4 /100 | #167 | Average 11.7% |
| Immigrants | Latin America | 54.1 /100 | #168 | Average 11.7% |
| Immigrants | Austria | 53.4 /100 | #169 | Average 11.7% |
| Immigrants | Albania | 52.8 /100 | #170 | Average 11.7% |
| Immigrants | Southern Europe | 52.8 /100 | #171 | Average 11.7% |
| Trinidadians and Tobagonians | 52.7 /100 | #172 | Average 11.7% |
| Maltese | 50.6 /100 | #173 | Average 11.7% |
Demographics Similar to Aleuts by Disability
In terms of disability, the demographic groups most similar to Aleuts are Marshallese (13.1%, a difference of 0.0%), Celtic (13.1%, a difference of 0.30%), Yaqui (13.1%, a difference of 0.36%), Nonimmigrants (13.2%, a difference of 0.42%), and Central American Indian (13.2%, a difference of 0.46%).
| Demographics | Rating | Rank | Disability |
| Crow | 0.0 /100 | #285 | Tragic 12.9% |
| English | 0.0 /100 | #286 | Tragic 13.0% |
| Africans | 0.0 /100 | #287 | Tragic 13.0% |
| Whites/Caucasians | 0.0 /100 | #288 | Tragic 13.0% |
| Slovaks | 0.0 /100 | #289 | Tragic 13.0% |
| Cheyenne | 0.0 /100 | #290 | Tragic 13.0% |
| Yaqui | 0.0 /100 | #291 | Tragic 13.1% |
| Aleuts | 0.0 /100 | #292 | Tragic 13.1% |
| Marshallese | 0.0 /100 | #293 | Tragic 13.1% |
| Celtics | 0.0 /100 | #294 | Tragic 13.1% |
| Immigrants | Nonimmigrants | 0.0 /100 | #295 | Tragic 13.2% |
| Central American Indians | 0.0 /100 | #296 | Tragic 13.2% |
| Hopi | 0.0 /100 | #297 | Tragic 13.2% |
| Alaska Natives | 0.0 /100 | #298 | Tragic 13.2% |
| French | 0.0 /100 | #299 | Tragic 13.2% |