Okinawan vs Immigrants from South America Disability Age 35 to 64
COMPARE
Okinawan
Immigrants from South America
Disability Age 35 to 64
Disability Age 35 to 64 Comparison
Okinawans
Immigrants from South America
9.4%
DISABILITY AGE 35 TO 64
100.0/ 100
METRIC RATING
21st/ 347
METRIC RANK
9.9%
DISABILITY AGE 35 TO 64
99.7/ 100
METRIC RATING
60th/ 347
METRIC RANK
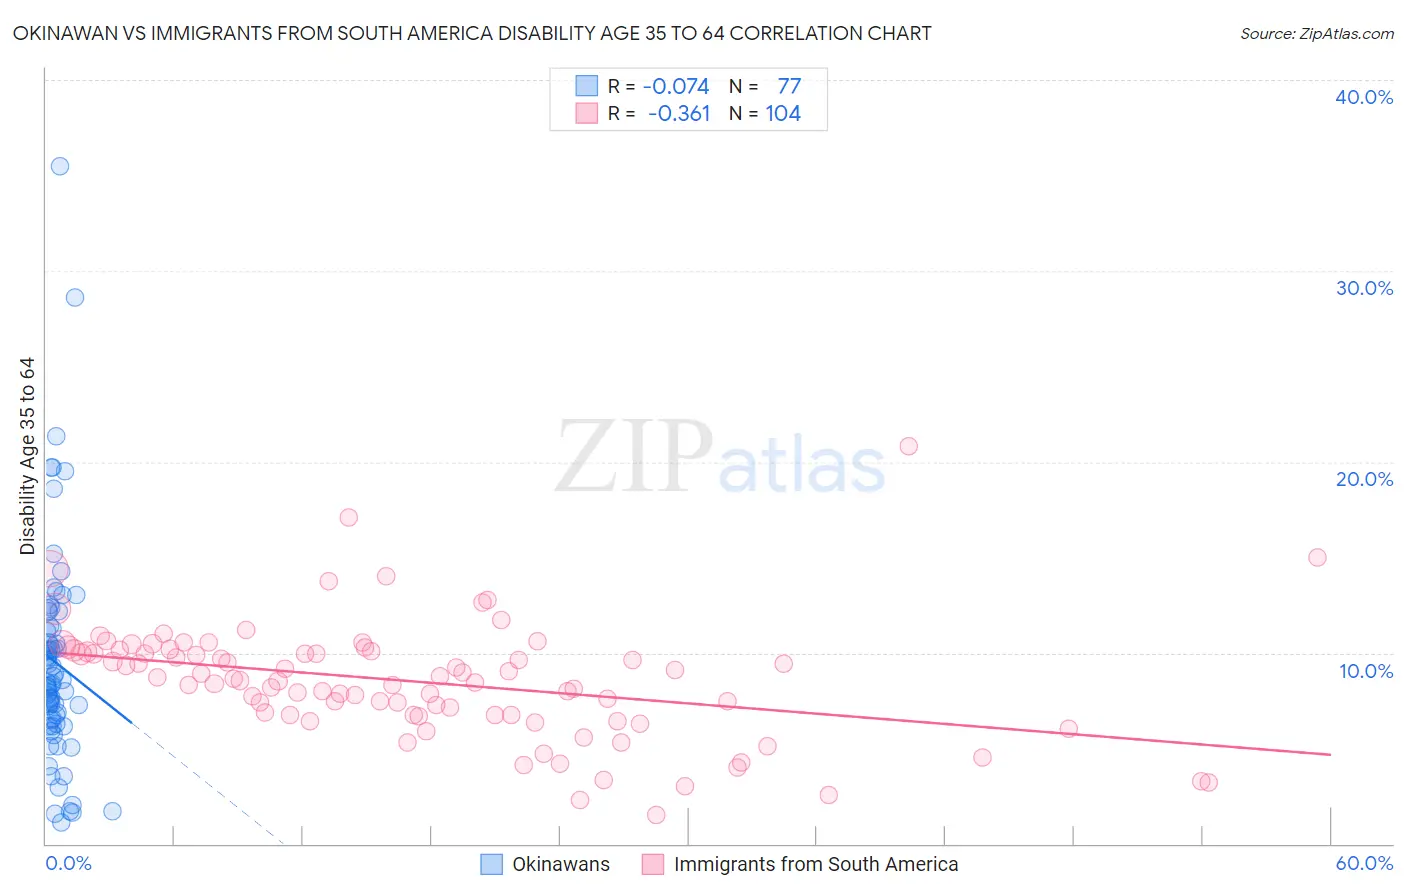
Okinawan vs Immigrants from South America Disability Age 35 to 64 Correlation Chart
The statistical analysis conducted on geographies consisting of 73,717,976 people shows a slight negative correlation between the proportion of Okinawans and percentage of population with a disability between the ages 34 and 64 in the United States with a correlation coefficient (R) of -0.074 and weighted average of 9.4%. Similarly, the statistical analysis conducted on geographies consisting of 485,897,340 people shows a mild negative correlation between the proportion of Immigrants from South America and percentage of population with a disability between the ages 34 and 64 in the United States with a correlation coefficient (R) of -0.361 and weighted average of 9.9%, a difference of 6.2%.
Disability Age 35 to 64 Correlation Summary
| Measurement | Okinawan | Immigrants from South America |
| Minimum | 1.1% | 1.5% |
| Maximum | 35.5% | 20.8% |
| Range | 34.4% | 19.3% |
| Mean | 9.5% | 8.5% |
| Median | 8.4% | 8.6% |
| Interquartile 25% (IQ1) | 6.4% | 6.7% |
| Interquartile 75% (IQ3) | 11.3% | 10.1% |
| Interquartile Range (IQR) | 4.9% | 3.4% |
| Standard Deviation (Sample) | 5.7% | 3.1% |
| Standard Deviation (Population) | 5.7% | 3.0% |
Similar Demographics by Disability Age 35 to 64
Demographics Similar to Okinawans by Disability Age 35 to 64
In terms of disability age 35 to 64, the demographic groups most similar to Okinawans are Cypriot (9.4%, a difference of 0.030%), Argentinean (9.4%, a difference of 0.25%), Asian (9.4%, a difference of 0.26%), Immigrants from Argentina (9.3%, a difference of 0.43%), and Venezuelan (9.4%, a difference of 0.56%).
| Demographics | Rating | Rank | Disability Age 35 to 64 |
| Immigrants | Singapore | 100.0 /100 | #14 | Exceptional 8.9% |
| Bolivians | 100.0 /100 | #15 | Exceptional 8.9% |
| Immigrants | Korea | 100.0 /100 | #16 | Exceptional 9.0% |
| Burmese | 100.0 /100 | #17 | Exceptional 9.2% |
| Soviet Union | 100.0 /100 | #18 | Exceptional 9.2% |
| Immigrants | Venezuela | 100.0 /100 | #19 | Exceptional 9.3% |
| Immigrants | Argentina | 100.0 /100 | #20 | Exceptional 9.3% |
| Okinawans | 100.0 /100 | #21 | Exceptional 9.4% |
| Cypriots | 100.0 /100 | #22 | Exceptional 9.4% |
| Argentineans | 100.0 /100 | #23 | Exceptional 9.4% |
| Asians | 100.0 /100 | #24 | Exceptional 9.4% |
| Venezuelans | 100.0 /100 | #25 | Exceptional 9.4% |
| Immigrants | Sri Lanka | 100.0 /100 | #26 | Exceptional 9.5% |
| Immigrants | Asia | 100.0 /100 | #27 | Exceptional 9.5% |
| Immigrants | Pakistan | 100.0 /100 | #28 | Exceptional 9.5% |
Demographics Similar to Immigrants from South America by Disability Age 35 to 64
In terms of disability age 35 to 64, the demographic groups most similar to Immigrants from South America are Immigrants from Spain (10.0%, a difference of 0.12%), Immigrants from Sweden (9.9%, a difference of 0.21%), Eastern European (10.0%, a difference of 0.22%), Immigrants from Czechoslovakia (10.0%, a difference of 0.34%), and Armenian (9.9%, a difference of 0.51%).
| Demographics | Rating | Rank | Disability Age 35 to 64 |
| Taiwanese | 99.8 /100 | #53 | Exceptional 9.8% |
| Immigrants | Russia | 99.8 /100 | #54 | Exceptional 9.8% |
| Peruvians | 99.8 /100 | #55 | Exceptional 9.9% |
| South Americans | 99.8 /100 | #56 | Exceptional 9.9% |
| Colombians | 99.8 /100 | #57 | Exceptional 9.9% |
| Armenians | 99.8 /100 | #58 | Exceptional 9.9% |
| Immigrants | Sweden | 99.7 /100 | #59 | Exceptional 9.9% |
| Immigrants | South America | 99.7 /100 | #60 | Exceptional 9.9% |
| Immigrants | Spain | 99.7 /100 | #61 | Exceptional 10.0% |
| Eastern Europeans | 99.7 /100 | #62 | Exceptional 10.0% |
| Immigrants | Czechoslovakia | 99.7 /100 | #63 | Exceptional 10.0% |
| Immigrants | Romania | 99.7 /100 | #64 | Exceptional 10.0% |
| Immigrants | Poland | 99.6 /100 | #65 | Exceptional 10.0% |
| Cubans | 99.6 /100 | #66 | Exceptional 10.0% |
| Immigrants | Uzbekistan | 99.5 /100 | #67 | Exceptional 10.1% |