Immigrants from Germany vs Immigrants from South America Disability Age 35 to 64

COMPARE

Immigrants from Germany
Race
Ancestry
AfghanAfricanAlaska NativeAlaskan AthabascanAlbanianAleutAlsatianAmericanApacheArabArapahoArgentineanArmenianAssyrian/Chaldean/SyriacAustralianAustrianBahamianBangladeshiBarbadianBasqueBelgianBelizeanBermudanBhutaneseBlackfeetBolivianBrazilianBritishBritish West IndianBulgarianBurmeseCajunCambodianCanadianCape VerdeanCarpatho RusynCelticCentral AmericanCentral American IndianCherokeeCheyenneChickasawChileanChineseChippewaChoctawColombianColvilleComancheCosta RicanCreeCreekCroatianCrowCubanCypriotCzechCzechoslovakianDanishDelawareDominicanDutchDutch West IndianEastern EuropeanEcuadorianEgyptianEnglishEstonianEthiopianEuropeanFijianFilipinoFinnishFrenchFrench American IndianFrench CanadianGermanGerman RussianGhanaianGreekGuamanian/ChamorroGuatemalanGuyaneseHaitianHmongHonduranHopiHoumaHungarianIcelanderIndian (Asian)IndonesianInupiatIranianIraqiIrishIroquoisIsraeliItalianJamaicanJapaneseJordanianKenyanKiowaKoreanLaotianLatvianLebaneseLiberianLithuanianLumbeeLuxembourgerMacedonianMalaysianMalteseMarshalleseMenomineeMexicanMexican American IndianMongolianMoroccanNative HawaiianNavajoNepaleseNew ZealanderNicaraguanNigerianNorthern EuropeanNorwegianOkinawanOsageOttawaPaiutePakistaniPalestinianPanamanianParaguayanPennsylvania GermanPeruvianPimaPolishPortuguesePotawatomiPuebloPuerto RicanPuget Sound SalishRomanianRussianSalvadoranSamoanScandinavianScotch-IrishScottishSeminoleSenegaleseSerbianShoshoneSierra LeoneanSiouxSlavicSlovakSloveneSomaliSouth AfricanSouth AmericanSouth American IndianSoviet UnionSpaniardSpanishSpanish AmericanSpanish American IndianSri LankanSubsaharan AfricanSudaneseSwedishSwissSyrianTaiwaneseThaiTlingit-HaidaTohono O'OdhamTonganTrinidadian and TobagonianTsimshianTurkishU.S. Virgin IslanderUgandanUkrainianUruguayanUteVenezuelanVietnameseWelshWest IndianYakamaYaquiYugoslavianYumanYup'ikZimbabwean
Immigration
NonimmigrantsImmigrantsAfghanistanAfricaAlbaniaArgentinaArmeniaAsiaAustraliaAustriaBahamasBangladeshBarbadosBelarusBelgiumBelizeBoliviaBosnia and HerzegovinaBrazilBulgariaBurma/MyanmarCabo VerdeCambodiaCameroonCanadaCaribbeanCentral AmericaChileChinaColombiaCongoCosta RicaCroatiaCubaCzechoslovakiaDenmarkDominicaDominican RepublicEastern AfricaEastern AsiaEastern EuropeEcuadorEgyptEl SalvadorEnglandEritreaEthiopiaEuropeFijiFranceGermanyGhanaGreeceGrenadaGuatemalaGuyanaHaitiHondurasHong KongHungaryIndiaIndonesiaIranIraqIrelandIsraelItalyJamaicaJapanJordanKazakhstanKenyaKoreaKuwaitLaosLatin AmericaLatviaLebanonLiberiaLithuaniaMalaysiaMexicoMicronesiaMiddle AfricaMoldovaMoroccoNepalNetherlandsNicaraguaNigeriaNorth AmericaNorth MacedoniaNorthern AfricaNorthern EuropeNorwayOceaniaPakistanPanamaPeruPhilippinesPolandPortugalRomaniaRussiaSaudi ArabiaScotlandSenegalSerbiaSierra LeoneSingaporeSomaliaSouth AfricaSouth Central AsiaSouth Eastern AsiaSouthern EuropeSpainSri LankaSt. Vincent and the GrenadinesSudanSwedenSwitzerlandSyriaTaiwanThailandTrinidad and TobagoTurkeyUgandaUkraineUruguayUzbekistanVenezuelaVietnamWest IndiesWestern AfricaWestern AsiaWestern EuropeYemenZaireZimbabweAzores
Immigrants from South America
Race
Ancestry
AfghanAfricanAlaska NativeAlaskan AthabascanAlbanianAleutAlsatianAmericanApacheArabArapahoArgentineanArmenianAssyrian/Chaldean/SyriacAustralianAustrianBahamianBangladeshiBarbadianBasqueBelgianBelizeanBermudanBhutaneseBlackfeetBolivianBrazilianBritishBritish West IndianBulgarianBurmeseCajunCambodianCanadianCape VerdeanCarpatho RusynCelticCentral AmericanCentral American IndianCherokeeCheyenneChickasawChileanChineseChippewaChoctawColombianColvilleComancheCosta RicanCreeCreekCroatianCrowCubanCypriotCzechCzechoslovakianDanishDelawareDominicanDutchDutch West IndianEastern EuropeanEcuadorianEgyptianEnglishEstonianEthiopianEuropeanFijianFilipinoFinnishFrenchFrench American IndianFrench CanadianGermanGerman RussianGhanaianGreekGuamanian/ChamorroGuatemalanGuyaneseHaitianHmongHonduranHopiHoumaHungarianIcelanderIndian (Asian)IndonesianInupiatIranianIraqiIrishIroquoisIsraeliItalianJamaicanJapaneseJordanianKenyanKiowaKoreanLaotianLatvianLebaneseLiberianLithuanianLumbeeLuxembourgerMacedonianMalaysianMalteseMarshalleseMenomineeMexicanMexican American IndianMongolianMoroccanNative HawaiianNavajoNepaleseNew ZealanderNicaraguanNigerianNorthern EuropeanNorwegianOkinawanOsageOttawaPaiutePakistaniPalestinianPanamanianParaguayanPennsylvania GermanPeruvianPimaPolishPortuguesePotawatomiPuebloPuerto RicanPuget Sound SalishRomanianRussianSalvadoranSamoanScandinavianScotch-IrishScottishSeminoleSenegaleseSerbianShoshoneSierra LeoneanSiouxSlavicSlovakSloveneSomaliSouth AfricanSouth AmericanSouth American IndianSoviet UnionSpaniardSpanishSpanish AmericanSpanish American IndianSri LankanSubsaharan AfricanSudaneseSwedishSwissSyrianTaiwaneseThaiTlingit-HaidaTohono O'OdhamTonganTrinidadian and TobagonianTsimshianTurkishU.S. Virgin IslanderUgandanUkrainianUruguayanUteVenezuelanVietnameseWelshWest IndianYakamaYaquiYugoslavianYumanYup'ikZimbabwean
Immigration
NonimmigrantsImmigrantsAfghanistanAfricaAlbaniaArgentinaArmeniaAsiaAustraliaAustriaBahamasBangladeshBarbadosBelarusBelgiumBelizeBoliviaBosnia and HerzegovinaBrazilBulgariaBurma/MyanmarCabo VerdeCambodiaCameroonCanadaCaribbeanCentral AmericaChileChinaColombiaCongoCosta RicaCroatiaCubaCzechoslovakiaDenmarkDominicaDominican RepublicEastern AfricaEastern AsiaEastern EuropeEcuadorEgyptEl SalvadorEnglandEritreaEthiopiaEuropeFijiFranceGhanaGreeceGrenadaGuatemalaGuyanaHaitiHondurasHong KongHungaryIndiaIndonesiaIranIraqIrelandIsraelItalyJamaicaJapanJordanKazakhstanKenyaKoreaKuwaitLaosLatin AmericaLatviaLebanonLiberiaLithuaniaMalaysiaMexicoMicronesiaMiddle AfricaMoldovaMoroccoNepalNetherlandsNicaraguaNigeriaNorth AmericaNorth MacedoniaNorthern AfricaNorthern EuropeNorwayOceaniaPakistanPanamaPeruPhilippinesPolandPortugalRomaniaRussiaSaudi ArabiaScotlandSenegalSerbiaSierra LeoneSingaporeSomaliaSouth AfricaSouth AmericaSouth Central AsiaSouth Eastern AsiaSouthern EuropeSpainSri LankaSt. Vincent and the GrenadinesSudanSwedenSwitzerlandSyriaTaiwanThailandTrinidad and TobagoTurkeyUgandaUkraineUruguayUzbekistanVenezuelaVietnamWest IndiesWestern AfricaWestern AsiaWestern EuropeYemenZaireZimbabweAzores
Disability Age 35 to 64
Income
Poverty
Unemployment
Labor Participation
Family Structure
Vehicle Availability
Education Level
Disability

Disability Age 35 to 64 Comparison

Immigrants from Germany

Immigrants from South America

Tragic
Exceptional
11.9%
DISABILITY AGE 35 TO 64
6.2/ 100
METRIC RATING
228th/ 347
METRIC RANK
9.9%
DISABILITY AGE 35 TO 64
99.7/ 100
METRIC RATING
60th/ 347
METRIC RANK

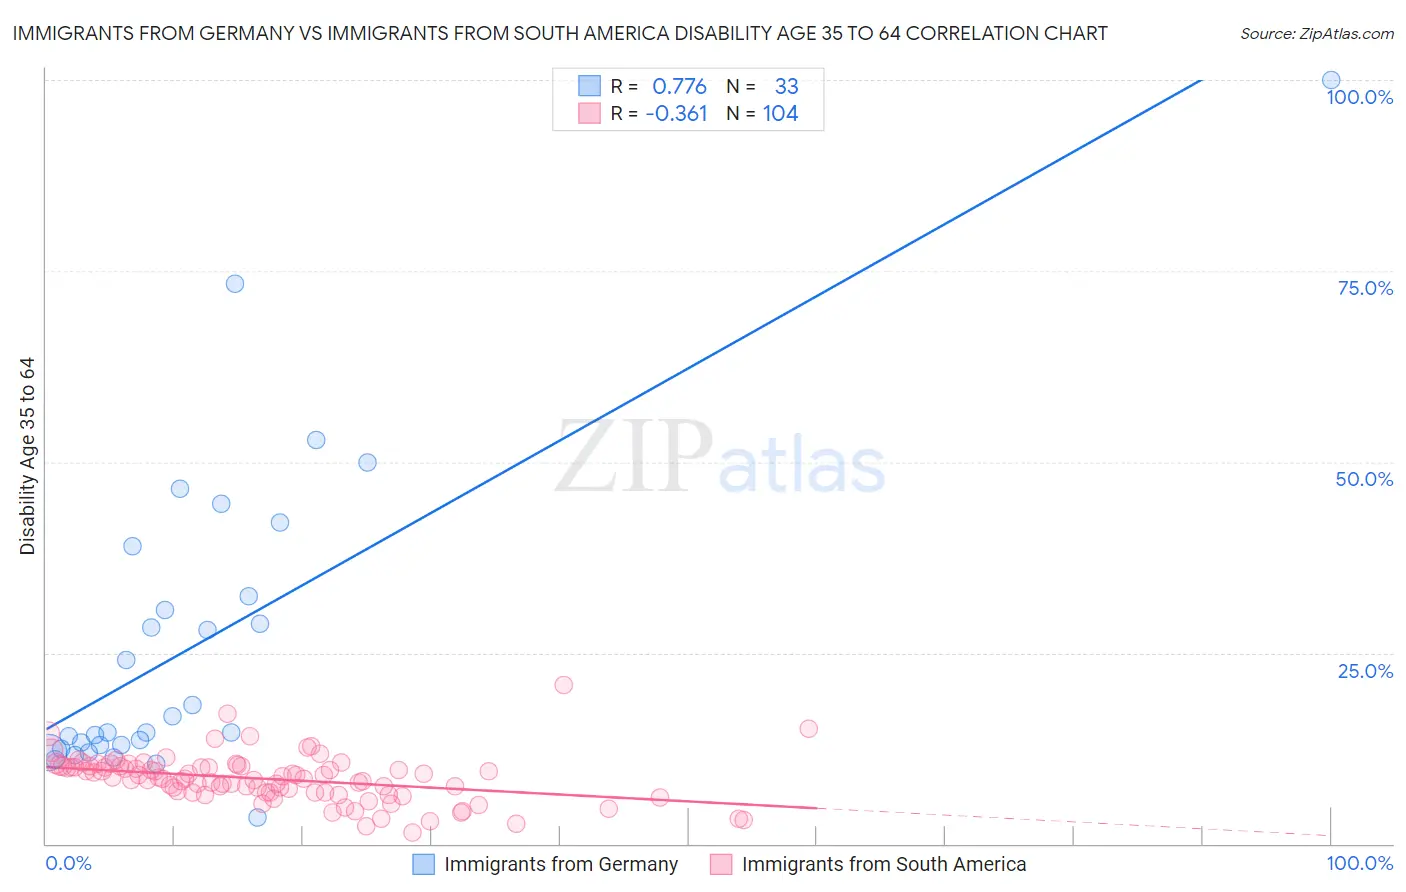
Immigrants from Germany vs Immigrants from South America Disability Age 35 to 64 Correlation Chart

The statistical analysis conducted on geographies consisting of 463,663,006 people shows a strong positive correlation between the proportion of Immigrants from Germany and percentage of population with a disability between the ages 34 and 64 in the United States with a correlation coefficient (R) of 0.776 and weighted average of 11.9%. Similarly, the statistical analysis conducted on geographies consisting of 485,897,340 people shows a mild negative correlation between the proportion of Immigrants from South America and percentage of population with a disability between the ages 34 and 64 in the United States with a correlation coefficient (R) of -0.361 and weighted average of 9.9%, a difference of 19.6%.
Immigrants from Germany vs Immigrants from South America Disability Age 35 to 64

Disability Age 35 to 64 Correlation Summary

MeasurementImmigrants from GermanyImmigrants from South America
Minimum3.4%1.5%
Maximum100.0%20.8%
Range96.6%19.3%
Mean26.2%8.5%
Median14.6%8.6%
Interquartile 25% (IQ1)12.7%6.7%
Interquartile 75% (IQ3)35.6%10.1%
Interquartile Range (IQR)23.0%3.4%
Standard Deviation (Sample)20.7%3.1%
Standard Deviation (Population)20.4%3.0%

Similar Demographics by Disability Age 35 to 64

Demographics Similar to Immigrants from Germany by Disability Age 35 to 64

In terms of disability age 35 to 64, the demographic groups most similar to Immigrants from Germany are British West Indian (11.9%, a difference of 0.020%), Immigrants from Central America (11.9%, a difference of 0.030%), Scandinavian (11.9%, a difference of 0.060%), Panamanian (11.9%, a difference of 0.12%), and Immigrants from Belize (11.9%, a difference of 0.14%).
DemographicsRating | RankDisability Age 35 to 64
Alsatians
8.5
/100
|
#221
Tragic
11.8%
Hondurans
8.4
/100
|
#222
Tragic
11.8%
Immigrants | Honduras
8.4
/100
|
#223
Tragic
11.8%
Immigrants | Ghana
7.8
/100
|
#224
Tragic
11.8%
Immigrants | Belize
6.6
/100
|
#225
Tragic
11.9%
Scandinavians
6.4
/100
|
#226
Tragic
11.9%
Immigrants | Central America
6.3
/100
|
#227
Tragic
11.9%
Immigrants | Germany
6.2
/100
|
#228
Tragic
11.9%
British West Indians
6.1
/100
|
#229
Tragic
11.9%
Panamanians
5.8
/100
|
#230
Tragic
11.9%
Jamaicans
5.7
/100
|
#231
Tragic
11.9%
Sudanese
5.3
/100
|
#232
Tragic
11.9%
Bermudans
5.0
/100
|
#233
Tragic
11.9%
Portuguese
4.9
/100
|
#234
Tragic
11.9%
Belizeans
4.5
/100
|
#235
Tragic
12.0%

Demographics Similar to Immigrants from South America by Disability Age 35 to 64

In terms of disability age 35 to 64, the demographic groups most similar to Immigrants from South America are Immigrants from Spain (10.0%, a difference of 0.12%), Immigrants from Sweden (9.9%, a difference of 0.21%), Eastern European (10.0%, a difference of 0.22%), Immigrants from Czechoslovakia (10.0%, a difference of 0.34%), and Armenian (9.9%, a difference of 0.51%).
DemographicsRating | RankDisability Age 35 to 64
Taiwanese
99.8
/100
|
#53
Exceptional
9.8%
Immigrants | Russia
99.8
/100
|
#54
Exceptional
9.8%
Peruvians
99.8
/100
|
#55
Exceptional
9.9%
South Americans
99.8
/100
|
#56
Exceptional
9.9%
Colombians
99.8
/100
|
#57
Exceptional
9.9%
Armenians
99.8
/100
|
#58
Exceptional
9.9%
Immigrants | Sweden
99.7
/100
|
#59
Exceptional
9.9%
Immigrants | South America
99.7
/100
|
#60
Exceptional
9.9%
Immigrants | Spain
99.7
/100
|
#61
Exceptional
10.0%
Eastern Europeans
99.7
/100
|
#62
Exceptional
10.0%
Immigrants | Czechoslovakia
99.7
/100
|
#63
Exceptional
10.0%
Immigrants | Romania
99.7
/100
|
#64
Exceptional
10.0%
Immigrants | Poland
99.6
/100
|
#65
Exceptional
10.0%
Cubans
99.6
/100
|
#66
Exceptional
10.0%
Immigrants | Uzbekistan
99.5
/100
|
#67
Exceptional
10.1%