Northern European vs Immigrants from Guyana Disability Age 18 to 34
COMPARE
Northern European
Immigrants from Guyana
Disability Age 18 to 34
Disability Age 18 to 34 Comparison
Northern Europeans
Immigrants from Guyana
7.3%
DISABILITY AGE 18 TO 34
0.2/ 100
METRIC RATING
261st/ 347
METRIC RANK
5.5%
DISABILITY AGE 18 TO 34
100.0/ 100
METRIC RATING
8th/ 347
METRIC RANK
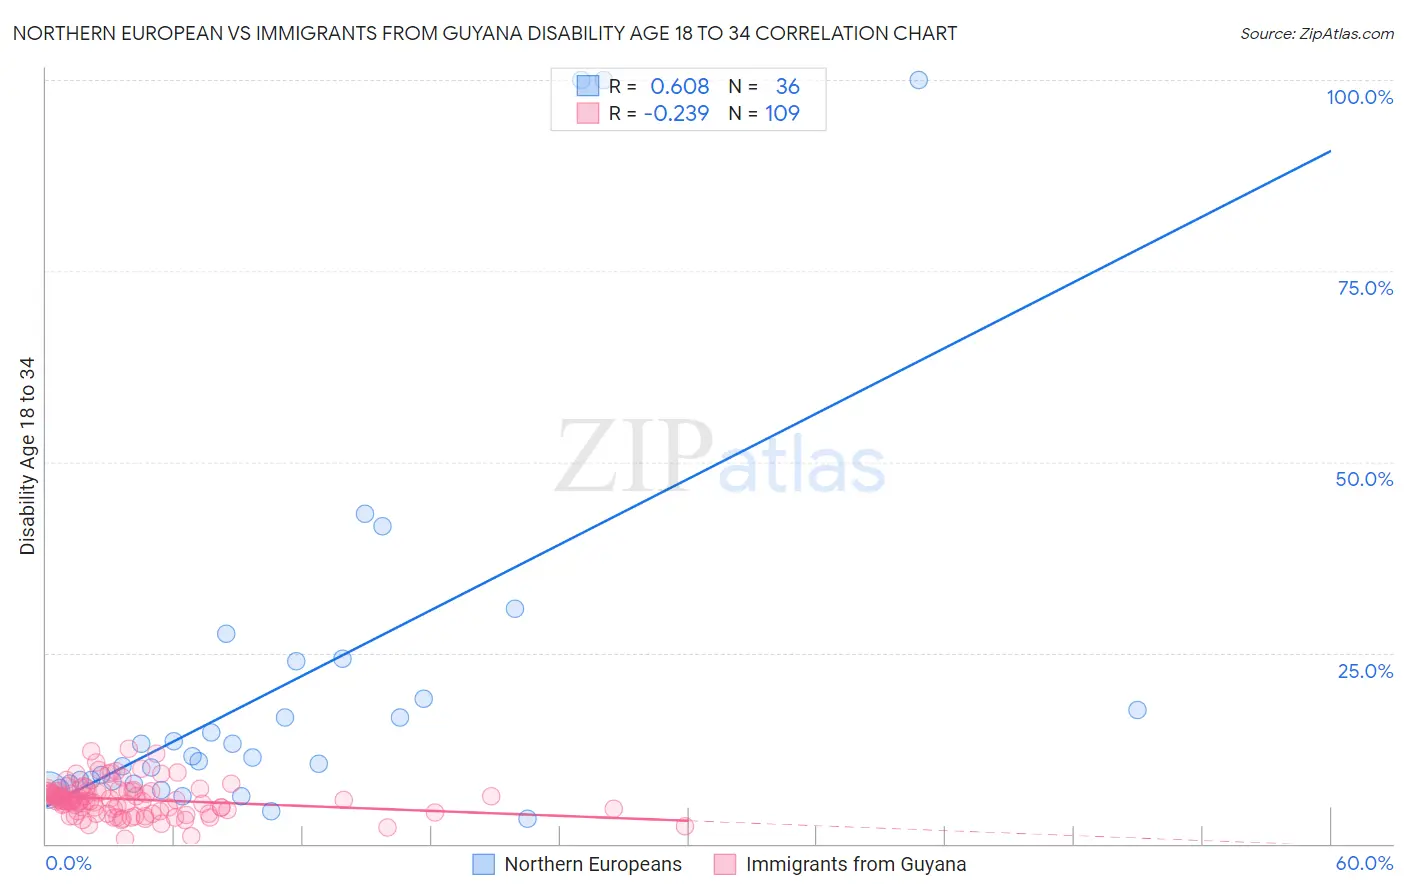
Northern European vs Immigrants from Guyana Disability Age 18 to 34 Correlation Chart
The statistical analysis conducted on geographies consisting of 404,691,388 people shows a significant positive correlation between the proportion of Northern Europeans and percentage of population with a disability between the ages 18 and 35 in the United States with a correlation coefficient (R) of 0.608 and weighted average of 7.3%. Similarly, the statistical analysis conducted on geographies consisting of 183,492,322 people shows a weak negative correlation between the proportion of Immigrants from Guyana and percentage of population with a disability between the ages 18 and 35 in the United States with a correlation coefficient (R) of -0.239 and weighted average of 5.5%, a difference of 33.3%.
Disability Age 18 to 34 Correlation Summary
| Measurement | Northern European | Immigrants from Guyana |
| Minimum | 3.3% | 0.58% |
| Maximum | 100.0% | 12.4% |
| Range | 96.7% | 11.8% |
| Mean | 21.4% | 5.8% |
| Median | 11.4% | 5.7% |
| Interquartile 25% (IQ1) | 8.0% | 4.3% |
| Interquartile 75% (IQ3) | 21.4% | 6.9% |
| Interquartile Range (IQR) | 13.4% | 2.6% |
| Standard Deviation (Sample) | 25.8% | 2.2% |
| Standard Deviation (Population) | 25.4% | 2.2% |
Similar Demographics by Disability Age 18 to 34
Demographics Similar to Northern Europeans by Disability Age 18 to 34
In terms of disability age 18 to 34, the demographic groups most similar to Northern Europeans are Canadian (7.3%, a difference of 0.030%), Tohono O'odham (7.3%, a difference of 0.17%), Somali (7.3%, a difference of 0.23%), Immigrants from Micronesia (7.3%, a difference of 0.30%), and British (7.3%, a difference of 0.32%).
| Demographics | Rating | Rank | Disability Age 18 to 34 |
| Indonesians | 0.4 /100 | #254 | Tragic 7.2% |
| Immigrants | Germany | 0.4 /100 | #255 | Tragic 7.2% |
| Immigrants | Laos | 0.4 /100 | #256 | Tragic 7.2% |
| Czechs | 0.3 /100 | #257 | Tragic 7.2% |
| Immigrants | Micronesia | 0.3 /100 | #258 | Tragic 7.3% |
| Somalis | 0.2 /100 | #259 | Tragic 7.3% |
| Tohono O'odham | 0.2 /100 | #260 | Tragic 7.3% |
| Northern Europeans | 0.2 /100 | #261 | Tragic 7.3% |
| Canadians | 0.2 /100 | #262 | Tragic 7.3% |
| British | 0.2 /100 | #263 | Tragic 7.3% |
| Bermudans | 0.1 /100 | #264 | Tragic 7.3% |
| Slovenes | 0.1 /100 | #265 | Tragic 7.3% |
| German Russians | 0.1 /100 | #266 | Tragic 7.4% |
| Bangladeshis | 0.1 /100 | #267 | Tragic 7.4% |
| Portuguese | 0.1 /100 | #268 | Tragic 7.4% |
Demographics Similar to Immigrants from Guyana by Disability Age 18 to 34
In terms of disability age 18 to 34, the demographic groups most similar to Immigrants from Guyana are Guyanese (5.5%, a difference of 0.50%), Immigrants from China (5.4%, a difference of 0.56%), Filipino (5.4%, a difference of 0.64%), Immigrants from Uzbekistan (5.5%, a difference of 0.65%), and Vietnamese (5.5%, a difference of 0.72%).
| Demographics | Rating | Rank | Disability Age 18 to 34 |
| Immigrants | Armenia | 100.0 /100 | #1 | Exceptional 5.0% |
| Immigrants | Hong Kong | 100.0 /100 | #2 | Exceptional 5.2% |
| Immigrants | Grenada | 100.0 /100 | #3 | Exceptional 5.3% |
| Immigrants | Cuba | 100.0 /100 | #4 | Exceptional 5.4% |
| Immigrants | Taiwan | 100.0 /100 | #5 | Exceptional 5.4% |
| Filipinos | 100.0 /100 | #6 | Exceptional 5.4% |
| Immigrants | China | 100.0 /100 | #7 | Exceptional 5.4% |
| Immigrants | Guyana | 100.0 /100 | #8 | Exceptional 5.5% |
| Guyanese | 100.0 /100 | #9 | Exceptional 5.5% |
| Immigrants | Uzbekistan | 100.0 /100 | #10 | Exceptional 5.5% |
| Vietnamese | 100.0 /100 | #11 | Exceptional 5.5% |
| Immigrants | St. Vincent and the Grenadines | 100.0 /100 | #12 | Exceptional 5.5% |
| Immigrants | Iran | 100.0 /100 | #13 | Exceptional 5.5% |
| Indians (Asian) | 100.0 /100 | #14 | Exceptional 5.5% |
| Immigrants | India | 100.0 /100 | #15 | Exceptional 5.6% |