Northern European vs Argentinean Disability Age 18 to 34
COMPARE
Northern European
Argentinean
Disability Age 18 to 34
Disability Age 18 to 34 Comparison
Northern Europeans
Argentineans
7.3%
DISABILITY AGE 18 TO 34
0.2/ 100
METRIC RATING
261st/ 347
METRIC RANK
5.8%
DISABILITY AGE 18 TO 34
99.9/ 100
METRIC RATING
33rd/ 347
METRIC RANK
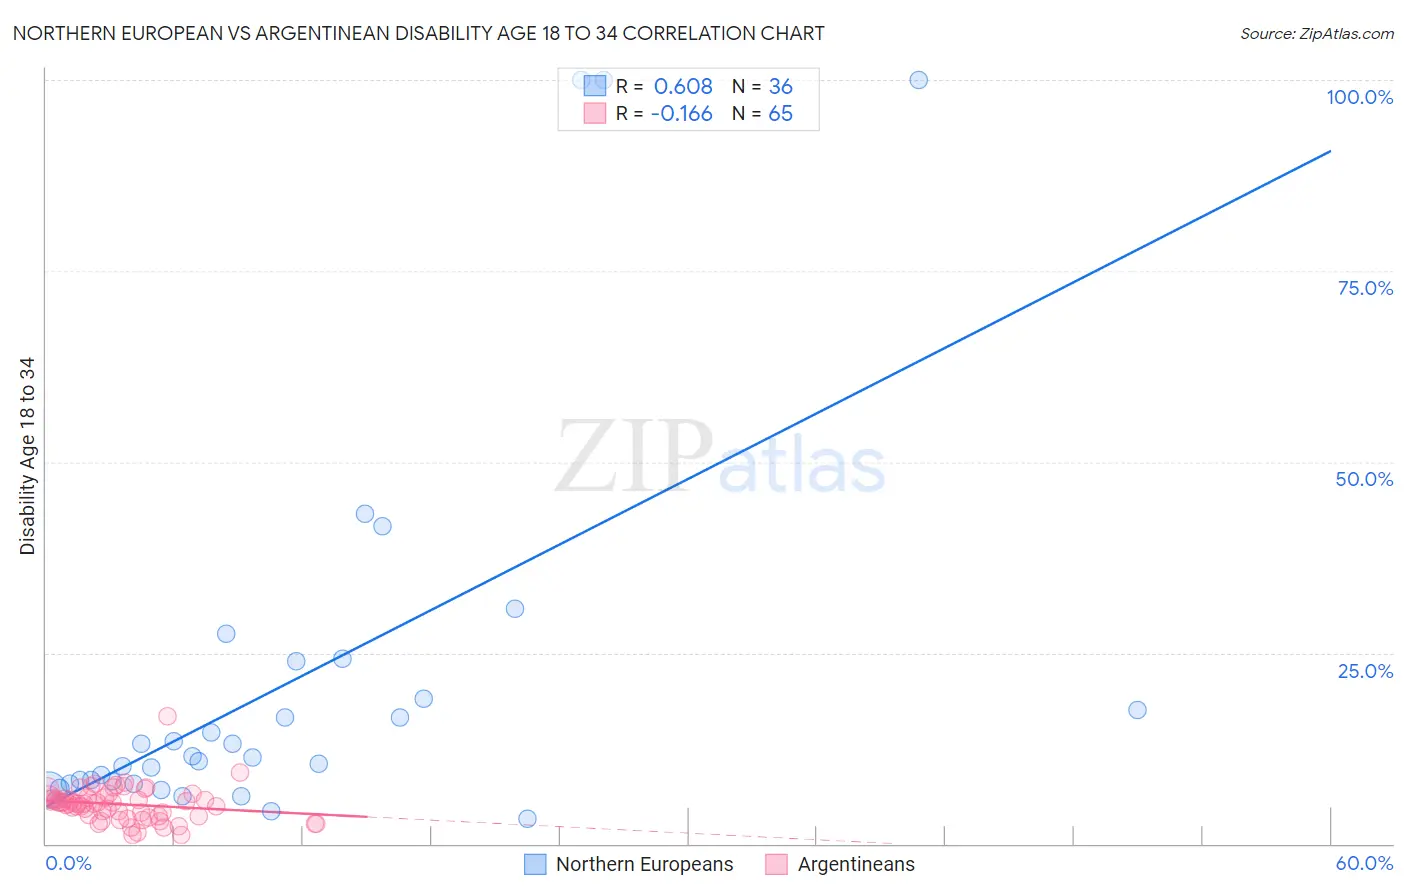
Northern European vs Argentinean Disability Age 18 to 34 Correlation Chart
The statistical analysis conducted on geographies consisting of 404,691,388 people shows a significant positive correlation between the proportion of Northern Europeans and percentage of population with a disability between the ages 18 and 35 in the United States with a correlation coefficient (R) of 0.608 and weighted average of 7.3%. Similarly, the statistical analysis conducted on geographies consisting of 296,774,562 people shows a poor negative correlation between the proportion of Argentineans and percentage of population with a disability between the ages 18 and 35 in the United States with a correlation coefficient (R) of -0.166 and weighted average of 5.8%, a difference of 26.6%.
Disability Age 18 to 34 Correlation Summary
| Measurement | Northern European | Argentinean |
| Minimum | 3.3% | 1.1% |
| Maximum | 100.0% | 16.6% |
| Range | 96.7% | 15.6% |
| Mean | 21.4% | 5.2% |
| Median | 11.4% | 5.3% |
| Interquartile 25% (IQ1) | 8.0% | 3.6% |
| Interquartile 75% (IQ3) | 21.4% | 6.0% |
| Interquartile Range (IQR) | 13.4% | 2.4% |
| Standard Deviation (Sample) | 25.8% | 2.3% |
| Standard Deviation (Population) | 25.4% | 2.3% |
Similar Demographics by Disability Age 18 to 34
Demographics Similar to Northern Europeans by Disability Age 18 to 34
In terms of disability age 18 to 34, the demographic groups most similar to Northern Europeans are Canadian (7.3%, a difference of 0.030%), Tohono O'odham (7.3%, a difference of 0.17%), Somali (7.3%, a difference of 0.23%), Immigrants from Micronesia (7.3%, a difference of 0.30%), and British (7.3%, a difference of 0.32%).
| Demographics | Rating | Rank | Disability Age 18 to 34 |
| Indonesians | 0.4 /100 | #254 | Tragic 7.2% |
| Immigrants | Germany | 0.4 /100 | #255 | Tragic 7.2% |
| Immigrants | Laos | 0.4 /100 | #256 | Tragic 7.2% |
| Czechs | 0.3 /100 | #257 | Tragic 7.2% |
| Immigrants | Micronesia | 0.3 /100 | #258 | Tragic 7.3% |
| Somalis | 0.2 /100 | #259 | Tragic 7.3% |
| Tohono O'odham | 0.2 /100 | #260 | Tragic 7.3% |
| Northern Europeans | 0.2 /100 | #261 | Tragic 7.3% |
| Canadians | 0.2 /100 | #262 | Tragic 7.3% |
| British | 0.2 /100 | #263 | Tragic 7.3% |
| Bermudans | 0.1 /100 | #264 | Tragic 7.3% |
| Slovenes | 0.1 /100 | #265 | Tragic 7.3% |
| German Russians | 0.1 /100 | #266 | Tragic 7.4% |
| Bangladeshis | 0.1 /100 | #267 | Tragic 7.4% |
| Portuguese | 0.1 /100 | #268 | Tragic 7.4% |
Demographics Similar to Argentineans by Disability Age 18 to 34
In terms of disability age 18 to 34, the demographic groups most similar to Argentineans are Iranian (5.8%, a difference of 0.020%), Immigrants from Barbados (5.8%, a difference of 0.020%), Venezuelan (5.8%, a difference of 0.19%), Immigrants from Pakistan (5.8%, a difference of 0.35%), and Immigrants from Lithuania (5.8%, a difference of 0.41%).
| Demographics | Rating | Rank | Disability Age 18 to 34 |
| Immigrants | Colombia | 100.0 /100 | #26 | Exceptional 5.7% |
| Immigrants | Venezuela | 99.9 /100 | #27 | Exceptional 5.7% |
| Soviet Union | 99.9 /100 | #28 | Exceptional 5.7% |
| Immigrants | Ecuador | 99.9 /100 | #29 | Exceptional 5.7% |
| Immigrants | Pakistan | 99.9 /100 | #30 | Exceptional 5.8% |
| Iranians | 99.9 /100 | #31 | Exceptional 5.8% |
| Immigrants | Barbados | 99.9 /100 | #32 | Exceptional 5.8% |
| Argentineans | 99.9 /100 | #33 | Exceptional 5.8% |
| Venezuelans | 99.9 /100 | #34 | Exceptional 5.8% |
| Immigrants | Lithuania | 99.9 /100 | #35 | Exceptional 5.8% |
| Ecuadorians | 99.9 /100 | #36 | Exceptional 5.8% |
| Armenians | 99.9 /100 | #37 | Exceptional 5.8% |
| Immigrants | South America | 99.9 /100 | #38 | Exceptional 5.8% |
| Asians | 99.9 /100 | #39 | Exceptional 5.8% |
| Bolivians | 99.9 /100 | #40 | Exceptional 5.8% |