Immigrants from Venezuela vs Immigrants from Eastern Asia Disability Age 18 to 34
COMPARE
Immigrants from Venezuela
Immigrants from Eastern Asia
Disability Age 18 to 34
Disability Age 18 to 34 Comparison
Immigrants from Venezuela
Immigrants from Eastern Asia
5.7%
DISABILITY AGE 18 TO 34
99.9/ 100
METRIC RATING
27th/ 347
METRIC RANK
5.6%
DISABILITY AGE 18 TO 34
100.0/ 100
METRIC RATING
17th/ 347
METRIC RANK
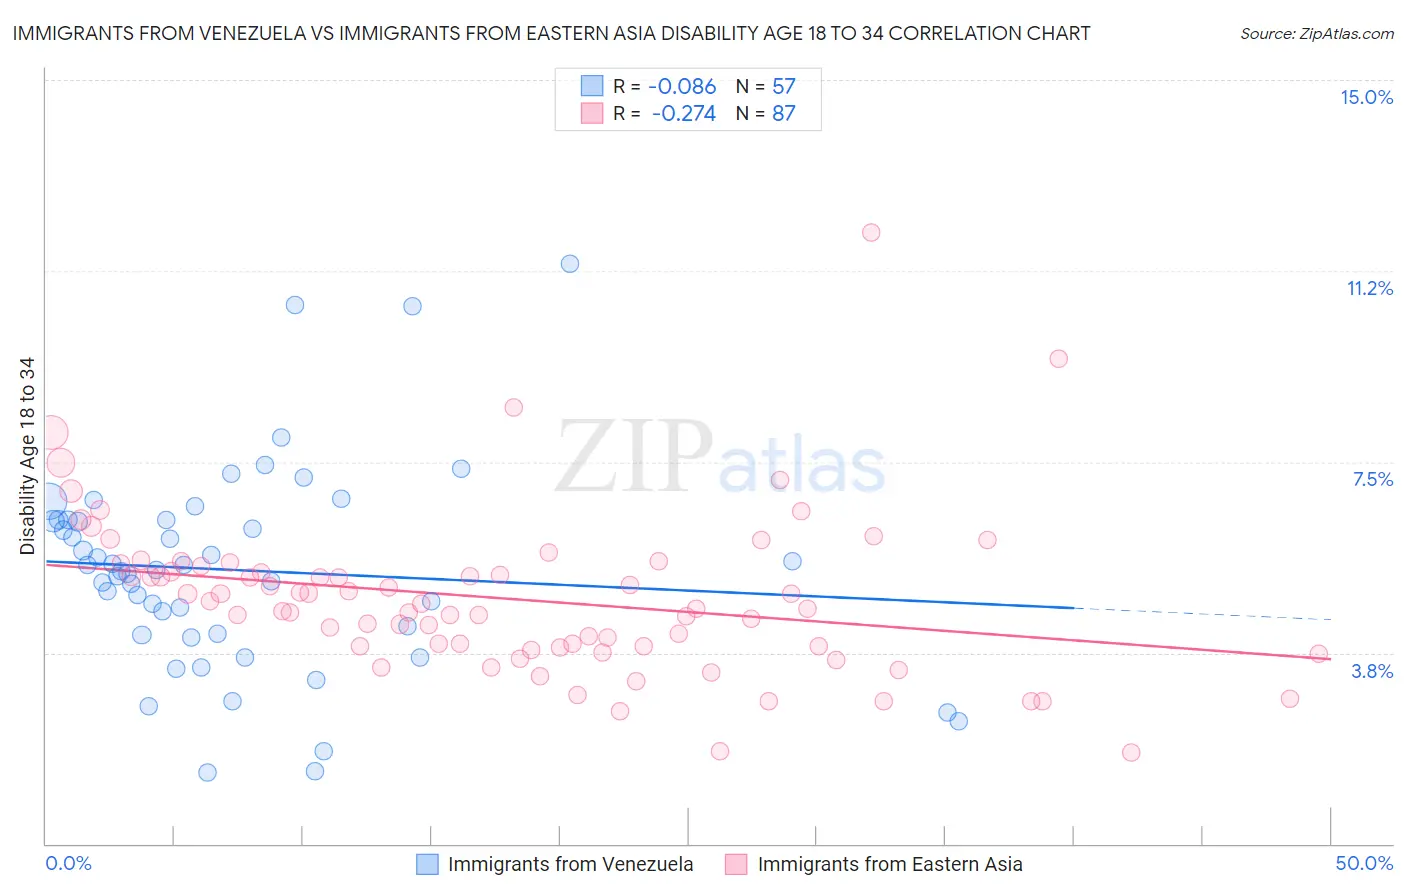
Immigrants from Venezuela vs Immigrants from Eastern Asia Disability Age 18 to 34 Correlation Chart
The statistical analysis conducted on geographies consisting of 287,578,630 people shows a slight negative correlation between the proportion of Immigrants from Venezuela and percentage of population with a disability between the ages 18 and 35 in the United States with a correlation coefficient (R) of -0.086 and weighted average of 5.7%. Similarly, the statistical analysis conducted on geographies consisting of 498,053,268 people shows a weak negative correlation between the proportion of Immigrants from Eastern Asia and percentage of population with a disability between the ages 18 and 35 in the United States with a correlation coefficient (R) of -0.274 and weighted average of 5.6%, a difference of 2.7%.
Disability Age 18 to 34 Correlation Summary
| Measurement | Immigrants from Venezuela | Immigrants from Eastern Asia |
| Minimum | 1.4% | 1.8% |
| Maximum | 11.4% | 12.0% |
| Range | 10.0% | 10.2% |
| Mean | 5.4% | 4.8% |
| Median | 5.4% | 4.6% |
| Interquartile 25% (IQ1) | 4.1% | 3.9% |
| Interquartile 75% (IQ3) | 6.4% | 5.5% |
| Interquartile Range (IQR) | 2.2% | 1.6% |
| Standard Deviation (Sample) | 2.0% | 1.6% |
| Standard Deviation (Population) | 2.0% | 1.6% |
Demographics Similar to Immigrants from Venezuela and Immigrants from Eastern Asia by Disability Age 18 to 34
In terms of disability age 18 to 34, the demographic groups most similar to Immigrants from Venezuela are Soviet Union (5.7%, a difference of 0.090%), Immigrants from Colombia (5.7%, a difference of 0.11%), Immigrants from Ecuador (5.7%, a difference of 0.18%), Immigrants from Singapore (5.7%, a difference of 0.26%), and Immigrants from Argentina (5.7%, a difference of 0.30%). Similarly, the demographic groups most similar to Immigrants from Eastern Asia are Immigrants from Israel (5.6%, a difference of 0.17%), Immigrants from India (5.6%, a difference of 0.20%), Indian (Asian) (5.5%, a difference of 0.58%), Immigrants from Iran (5.5%, a difference of 0.73%), and Immigrants from Bolivia (5.6%, a difference of 0.76%).
| Demographics | Rating | Rank | Disability Age 18 to 34 |
| Immigrants | St. Vincent and the Grenadines | 100.0 /100 | #12 | Exceptional 5.5% |
| Immigrants | Iran | 100.0 /100 | #13 | Exceptional 5.5% |
| Indians (Asian) | 100.0 /100 | #14 | Exceptional 5.5% |
| Immigrants | India | 100.0 /100 | #15 | Exceptional 5.6% |
| Immigrants | Israel | 100.0 /100 | #16 | Exceptional 5.6% |
| Immigrants | Eastern Asia | 100.0 /100 | #17 | Exceptional 5.6% |
| Immigrants | Bolivia | 100.0 /100 | #18 | Exceptional 5.6% |
| Thais | 100.0 /100 | #19 | Exceptional 5.6% |
| Immigrants | Bangladesh | 100.0 /100 | #20 | Exceptional 5.6% |
| Immigrants | South Central Asia | 100.0 /100 | #21 | Exceptional 5.7% |
| Immigrants | Nicaragua | 100.0 /100 | #22 | Exceptional 5.7% |
| Cubans | 100.0 /100 | #23 | Exceptional 5.7% |
| Immigrants | Argentina | 100.0 /100 | #24 | Exceptional 5.7% |
| Immigrants | Singapore | 100.0 /100 | #25 | Exceptional 5.7% |
| Immigrants | Colombia | 100.0 /100 | #26 | Exceptional 5.7% |
| Immigrants | Venezuela | 99.9 /100 | #27 | Exceptional 5.7% |
| Soviet Union | 99.9 /100 | #28 | Exceptional 5.7% |
| Immigrants | Ecuador | 99.9 /100 | #29 | Exceptional 5.7% |
| Immigrants | Pakistan | 99.9 /100 | #30 | Exceptional 5.8% |
| Iranians | 99.9 /100 | #31 | Exceptional 5.8% |
| Immigrants | Barbados | 99.9 /100 | #32 | Exceptional 5.8% |