Navajo vs Iroquois Disability Age 18 to 34
COMPARE
Navajo
Iroquois
Disability Age 18 to 34
Disability Age 18 to 34 Comparison
Navajo
Iroquois
8.1%
DISABILITY AGE 18 TO 34
0.0/ 100
METRIC RATING
320th/ 347
METRIC RANK
7.9%
DISABILITY AGE 18 TO 34
0.0/ 100
METRIC RATING
313th/ 347
METRIC RANK
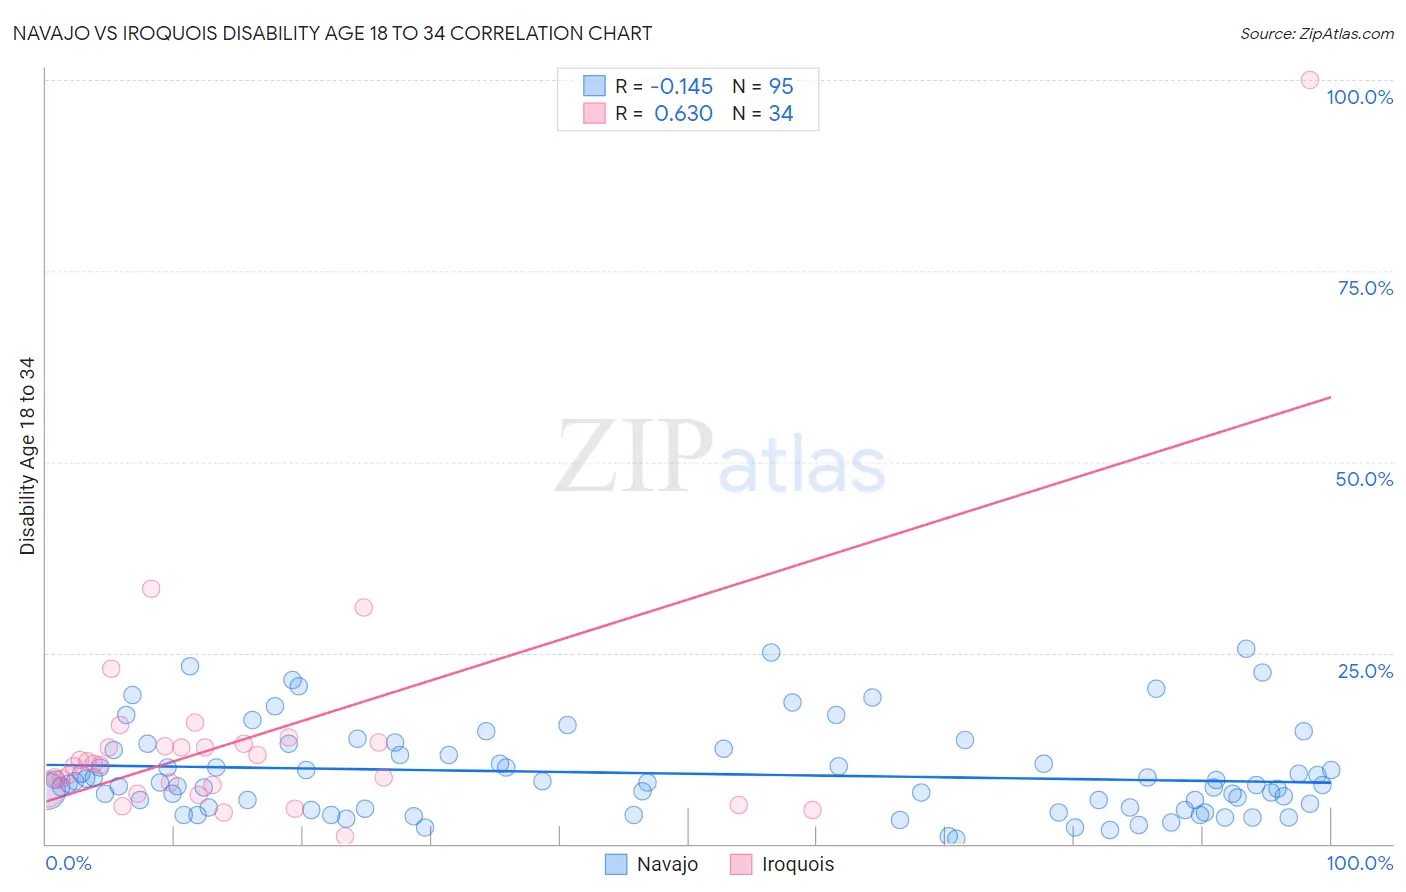
Navajo vs Iroquois Disability Age 18 to 34 Correlation Chart
The statistical analysis conducted on geographies consisting of 224,432,910 people shows a poor negative correlation between the proportion of Navajo and percentage of population with a disability between the ages 18 and 35 in the United States with a correlation coefficient (R) of -0.145 and weighted average of 8.1%. Similarly, the statistical analysis conducted on geographies consisting of 207,019,096 people shows a significant positive correlation between the proportion of Iroquois and percentage of population with a disability between the ages 18 and 35 in the United States with a correlation coefficient (R) of 0.630 and weighted average of 7.9%, a difference of 2.4%.
Disability Age 18 to 34 Correlation Summary
| Measurement | Navajo | Iroquois |
| Minimum | 0.64% | 0.98% |
| Maximum | 25.5% | 100.0% |
| Range | 24.8% | 99.0% |
| Mean | 9.2% | 13.8% |
| Median | 7.9% | 10.4% |
| Interquartile 25% (IQ1) | 4.7% | 7.2% |
| Interquartile 75% (IQ3) | 12.3% | 13.0% |
| Interquartile Range (IQR) | 7.7% | 5.8% |
| Standard Deviation (Sample) | 5.7% | 16.7% |
| Standard Deviation (Population) | 5.7% | 16.4% |
Demographics Similar to Navajo and Iroquois by Disability Age 18 to 34
In terms of disability age 18 to 34, the demographic groups most similar to Navajo are Aleut (8.1%, a difference of 0.050%), French Canadian (8.1%, a difference of 0.090%), Blackfeet (8.1%, a difference of 0.36%), Cree (8.1%, a difference of 0.42%), and Hmong (8.1%, a difference of 0.51%). Similarly, the demographic groups most similar to Iroquois are Spanish American (7.9%, a difference of 0.040%), French (7.9%, a difference of 0.40%), Colville (7.9%, a difference of 0.44%), Finnish (7.8%, a difference of 1.1%), and American (8.0%, a difference of 1.2%).
| Demographics | Rating | Rank | Disability Age 18 to 34 |
| English | 0.0 /100 | #306 | Tragic 7.8% |
| Scotch-Irish | 0.0 /100 | #307 | Tragic 7.8% |
| Pennsylvania Germans | 0.0 /100 | #308 | Tragic 7.8% |
| Alaska Natives | 0.0 /100 | #309 | Tragic 7.8% |
| Finns | 0.0 /100 | #310 | Tragic 7.8% |
| French | 0.0 /100 | #311 | Tragic 7.9% |
| Spanish Americans | 0.0 /100 | #312 | Tragic 7.9% |
| Iroquois | 0.0 /100 | #313 | Tragic 7.9% |
| Colville | 0.0 /100 | #314 | Tragic 7.9% |
| Americans | 0.0 /100 | #315 | Tragic 8.0% |
| Puerto Ricans | 0.0 /100 | #316 | Tragic 8.0% |
| Hmong | 0.0 /100 | #317 | Tragic 8.1% |
| French Canadians | 0.0 /100 | #318 | Tragic 8.1% |
| Aleuts | 0.0 /100 | #319 | Tragic 8.1% |
| Navajo | 0.0 /100 | #320 | Tragic 8.1% |
| Blackfeet | 0.0 /100 | #321 | Tragic 8.1% |
| Cree | 0.0 /100 | #322 | Tragic 8.1% |
| French American Indians | 0.0 /100 | #323 | Tragic 8.2% |
| Cajuns | 0.0 /100 | #324 | Tragic 8.2% |
| Natives/Alaskans | 0.0 /100 | #325 | Tragic 8.2% |
| Potawatomi | 0.0 /100 | #326 | Tragic 8.2% |