Ghanaian vs Iroquois Disability Age 18 to 34
COMPARE
Ghanaian
Iroquois
Disability Age 18 to 34
Disability Age 18 to 34 Comparison
Ghanaians
Iroquois
6.6%
DISABILITY AGE 18 TO 34
54.7/ 100
METRIC RATING
172nd/ 347
METRIC RANK
7.9%
DISABILITY AGE 18 TO 34
0.0/ 100
METRIC RATING
313th/ 347
METRIC RANK
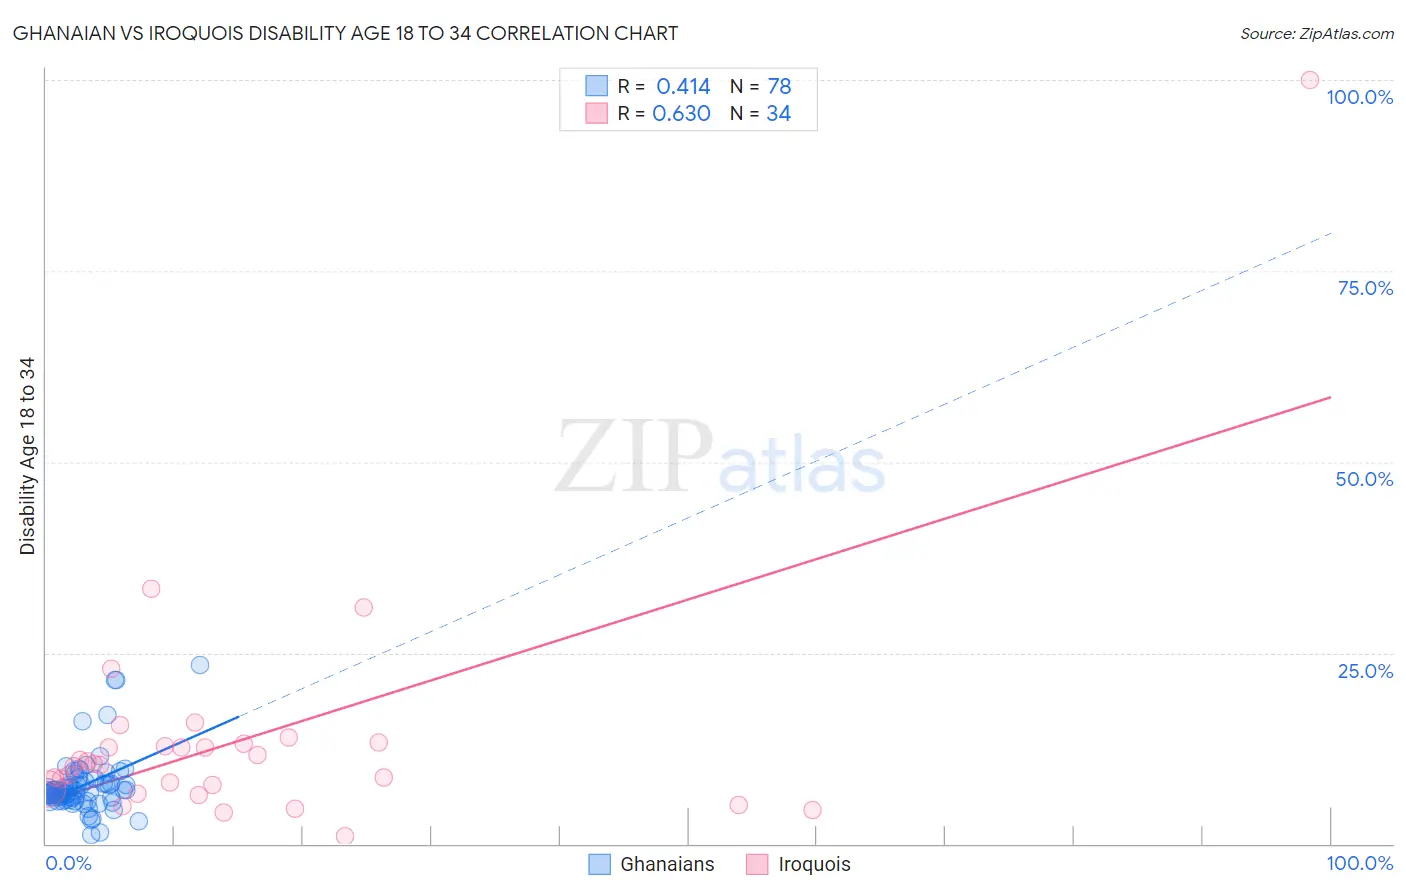
Ghanaian vs Iroquois Disability Age 18 to 34 Correlation Chart
The statistical analysis conducted on geographies consisting of 190,614,383 people shows a moderate positive correlation between the proportion of Ghanaians and percentage of population with a disability between the ages 18 and 35 in the United States with a correlation coefficient (R) of 0.414 and weighted average of 6.6%. Similarly, the statistical analysis conducted on geographies consisting of 207,019,096 people shows a significant positive correlation between the proportion of Iroquois and percentage of population with a disability between the ages 18 and 35 in the United States with a correlation coefficient (R) of 0.630 and weighted average of 7.9%, a difference of 20.2%.
Disability Age 18 to 34 Correlation Summary
| Measurement | Ghanaian | Iroquois |
| Minimum | 1.2% | 0.98% |
| Maximum | 23.5% | 100.0% |
| Range | 22.3% | 99.0% |
| Mean | 7.6% | 13.8% |
| Median | 6.7% | 10.4% |
| Interquartile 25% (IQ1) | 6.0% | 7.2% |
| Interquartile 75% (IQ3) | 7.9% | 13.0% |
| Interquartile Range (IQR) | 1.9% | 5.8% |
| Standard Deviation (Sample) | 3.8% | 16.7% |
| Standard Deviation (Population) | 3.8% | 16.4% |
Similar Demographics by Disability Age 18 to 34
Demographics Similar to Ghanaians by Disability Age 18 to 34
In terms of disability age 18 to 34, the demographic groups most similar to Ghanaians are Immigrants from Mexico (6.6%, a difference of 0.040%), Bahamian (6.6%, a difference of 0.050%), Immigrants from Bahamas (6.6%, a difference of 0.22%), Native Hawaiian (6.6%, a difference of 0.33%), and Russian (6.5%, a difference of 0.39%).
| Demographics | Rating | Rank | Disability Age 18 to 34 |
| Immigrants | Hungary | 69.6 /100 | #165 | Good 6.5% |
| Eastern Europeans | 65.1 /100 | #166 | Good 6.5% |
| Immigrants | Northern Europe | 64.1 /100 | #167 | Good 6.5% |
| Immigrants | Moldova | 63.1 /100 | #168 | Good 6.5% |
| Russians | 60.2 /100 | #169 | Good 6.5% |
| Immigrants | Bahamas | 57.9 /100 | #170 | Average 6.6% |
| Bahamians | 55.5 /100 | #171 | Average 6.6% |
| Ghanaians | 54.7 /100 | #172 | Average 6.6% |
| Immigrants | Mexico | 54.1 /100 | #173 | Average 6.6% |
| Native Hawaiians | 50.0 /100 | #174 | Average 6.6% |
| Immigrants | Cambodia | 46.5 /100 | #175 | Average 6.6% |
| Immigrants | Africa | 45.9 /100 | #176 | Average 6.6% |
| Syrians | 44.3 /100 | #177 | Average 6.6% |
| Nigerians | 43.7 /100 | #178 | Average 6.6% |
| Immigrants | Ghana | 42.1 /100 | #179 | Average 6.6% |
Demographics Similar to Iroquois by Disability Age 18 to 34
In terms of disability age 18 to 34, the demographic groups most similar to Iroquois are Spanish American (7.9%, a difference of 0.040%), French (7.9%, a difference of 0.40%), Colville (7.9%, a difference of 0.44%), Finnish (7.8%, a difference of 1.1%), and American (8.0%, a difference of 1.2%).
| Demographics | Rating | Rank | Disability Age 18 to 34 |
| English | 0.0 /100 | #306 | Tragic 7.8% |
| Scotch-Irish | 0.0 /100 | #307 | Tragic 7.8% |
| Pennsylvania Germans | 0.0 /100 | #308 | Tragic 7.8% |
| Alaska Natives | 0.0 /100 | #309 | Tragic 7.8% |
| Finns | 0.0 /100 | #310 | Tragic 7.8% |
| French | 0.0 /100 | #311 | Tragic 7.9% |
| Spanish Americans | 0.0 /100 | #312 | Tragic 7.9% |
| Iroquois | 0.0 /100 | #313 | Tragic 7.9% |
| Colville | 0.0 /100 | #314 | Tragic 7.9% |
| Americans | 0.0 /100 | #315 | Tragic 8.0% |
| Puerto Ricans | 0.0 /100 | #316 | Tragic 8.0% |
| Hmong | 0.0 /100 | #317 | Tragic 8.1% |
| French Canadians | 0.0 /100 | #318 | Tragic 8.1% |
| Aleuts | 0.0 /100 | #319 | Tragic 8.1% |
| Navajo | 0.0 /100 | #320 | Tragic 8.1% |