Lebanese vs Houma Disability Age 18 to 34
COMPARE
Lebanese
Houma
Disability Age 18 to 34
Disability Age 18 to 34 Comparison
Lebanese
Houma
6.8%
DISABILITY AGE 18 TO 34
13.3/ 100
METRIC RATING
205th/ 347
METRIC RANK
9.7%
DISABILITY AGE 18 TO 34
0.0/ 100
METRIC RATING
346th/ 347
METRIC RANK
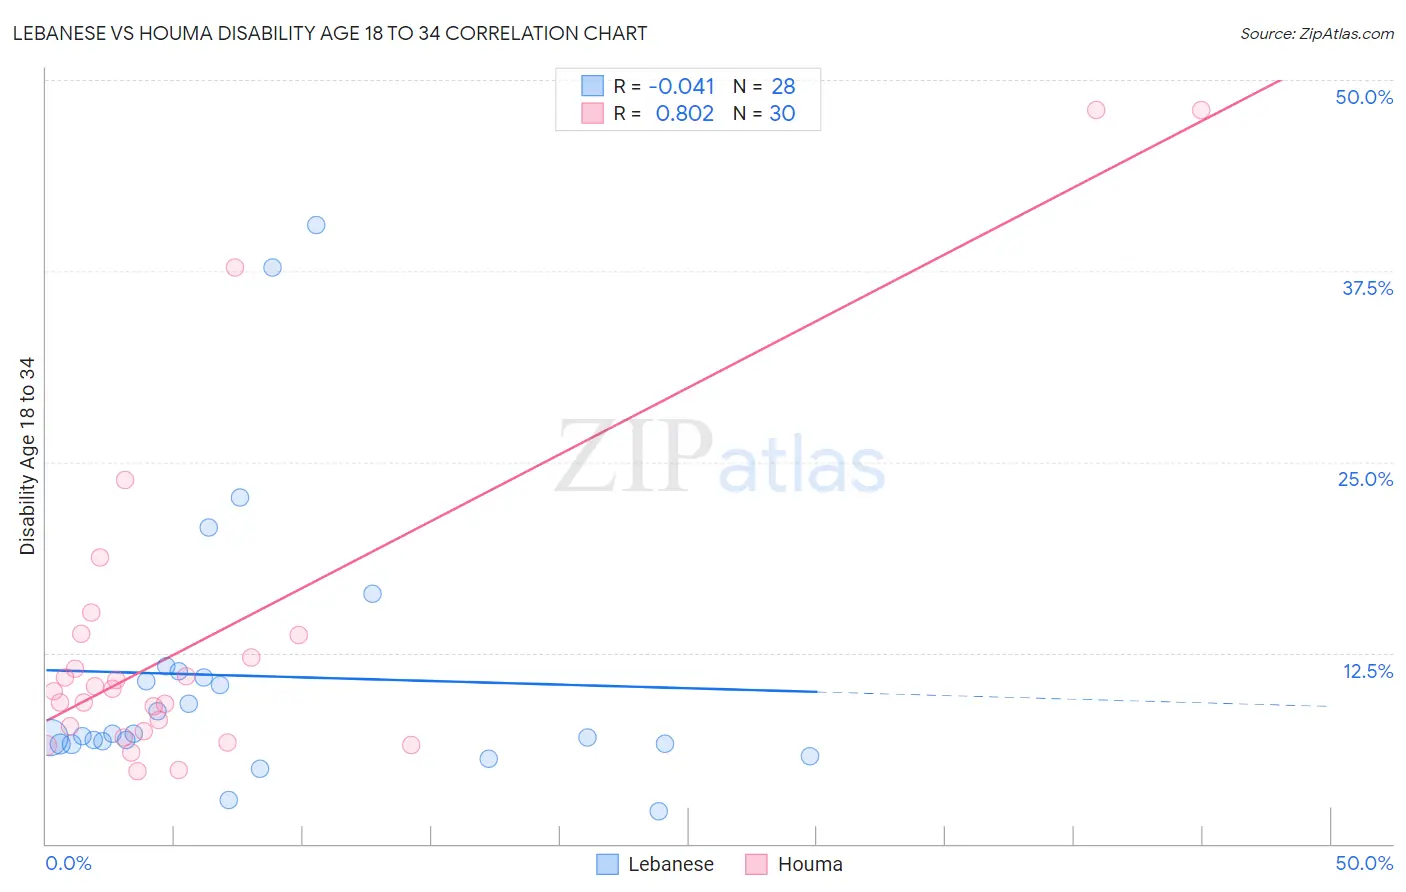
Lebanese vs Houma Disability Age 18 to 34 Correlation Chart
The statistical analysis conducted on geographies consisting of 400,691,364 people shows no correlation between the proportion of Lebanese and percentage of population with a disability between the ages 18 and 35 in the United States with a correlation coefficient (R) of -0.041 and weighted average of 6.8%. Similarly, the statistical analysis conducted on geographies consisting of 36,777,959 people shows a very strong positive correlation between the proportion of Houma and percentage of population with a disability between the ages 18 and 35 in the United States with a correlation coefficient (R) of 0.802 and weighted average of 9.7%, a difference of 42.3%.
Disability Age 18 to 34 Correlation Summary
| Measurement | Lebanese | Houma |
| Minimum | 2.1% | 4.7% |
| Maximum | 40.5% | 48.0% |
| Range | 38.4% | 43.3% |
| Mean | 11.0% | 13.6% |
| Median | 7.1% | 10.1% |
| Interquartile 25% (IQ1) | 6.6% | 7.3% |
| Interquartile 75% (IQ3) | 11.1% | 13.7% |
| Interquartile Range (IQR) | 4.5% | 6.4% |
| Standard Deviation (Sample) | 9.2% | 11.4% |
| Standard Deviation (Population) | 9.0% | 11.2% |
Similar Demographics by Disability Age 18 to 34
Demographics Similar to Lebanese by Disability Age 18 to 34
In terms of disability age 18 to 34, the demographic groups most similar to Lebanese are Immigrants from Bosnia and Herzegovina (6.8%, a difference of 0.050%), Hispanic or Latino (6.8%, a difference of 0.080%), Japanese (6.8%, a difference of 0.080%), Mexican (6.8%, a difference of 0.11%), and Immigrants from Scotland (6.8%, a difference of 0.13%).
| Demographics | Rating | Rank | Disability Age 18 to 34 |
| Australians | 19.4 /100 | #198 | Poor 6.8% |
| Kenyans | 18.3 /100 | #199 | Poor 6.8% |
| Sierra Leoneans | 17.5 /100 | #200 | Poor 6.8% |
| Greeks | 16.1 /100 | #201 | Poor 6.8% |
| Panamanians | 15.8 /100 | #202 | Poor 6.8% |
| Hispanics or Latinos | 13.8 /100 | #203 | Poor 6.8% |
| Immigrants | Bosnia and Herzegovina | 13.6 /100 | #204 | Poor 6.8% |
| Lebanese | 13.3 /100 | #205 | Poor 6.8% |
| Japanese | 12.8 /100 | #206 | Poor 6.8% |
| Mexicans | 12.6 /100 | #207 | Poor 6.8% |
| Immigrants | Scotland | 12.4 /100 | #208 | Poor 6.8% |
| Immigrants | Burma/Myanmar | 12.3 /100 | #209 | Poor 6.8% |
| Latvians | 11.1 /100 | #210 | Poor 6.8% |
| Immigrants | Norway | 10.0 /100 | #211 | Tragic 6.8% |
| Luxembourgers | 9.4 /100 | #212 | Tragic 6.9% |
Demographics Similar to Houma by Disability Age 18 to 34
In terms of disability age 18 to 34, the demographic groups most similar to Houma are Alaskan Athabascan (9.4%, a difference of 2.7%), Creek (9.0%, a difference of 7.6%), Chippewa (9.0%, a difference of 8.0%), Yakama (9.0%, a difference of 8.0%), and Chickasaw (9.0%, a difference of 8.1%).
| Demographics | Rating | Rank | Disability Age 18 to 34 |
| Apache | 0.0 /100 | #333 | Tragic 8.4% |
| Dutch West Indians | 0.0 /100 | #334 | Tragic 8.4% |
| Seminole | 0.0 /100 | #335 | Tragic 8.4% |
| Immigrants | Azores | 0.0 /100 | #336 | Tragic 8.5% |
| Ottawa | 0.0 /100 | #337 | Tragic 8.6% |
| Cherokee | 0.0 /100 | #338 | Tragic 8.7% |
| Kiowa | 0.0 /100 | #339 | Tragic 8.8% |
| Choctaw | 0.0 /100 | #340 | Tragic 9.0% |
| Chickasaw | 0.0 /100 | #341 | Tragic 9.0% |
| Yakama | 0.0 /100 | #342 | Tragic 9.0% |
| Chippewa | 0.0 /100 | #343 | Tragic 9.0% |
| Creek | 0.0 /100 | #344 | Tragic 9.0% |
| Alaskan Athabascans | 0.0 /100 | #345 | Tragic 9.4% |
| Houma | 0.0 /100 | #346 | Tragic 9.7% |
| Yuman | 0.0 /100 | #347 | Tragic 10.6% |