Immigrants from Barbados vs Immigrants from South America Disability Age Over 75
COMPARE
Immigrants from Barbados
Immigrants from South America
Disability Age Over 75
Disability Age Over 75 Comparison
Immigrants from Barbados
Immigrants from South America
47.9%
DISABILITY AGE OVER 75
10.7/ 100
METRIC RATING
214th/ 347
METRIC RANK
46.7%
DISABILITY AGE OVER 75
91.8/ 100
METRIC RATING
124th/ 347
METRIC RANK
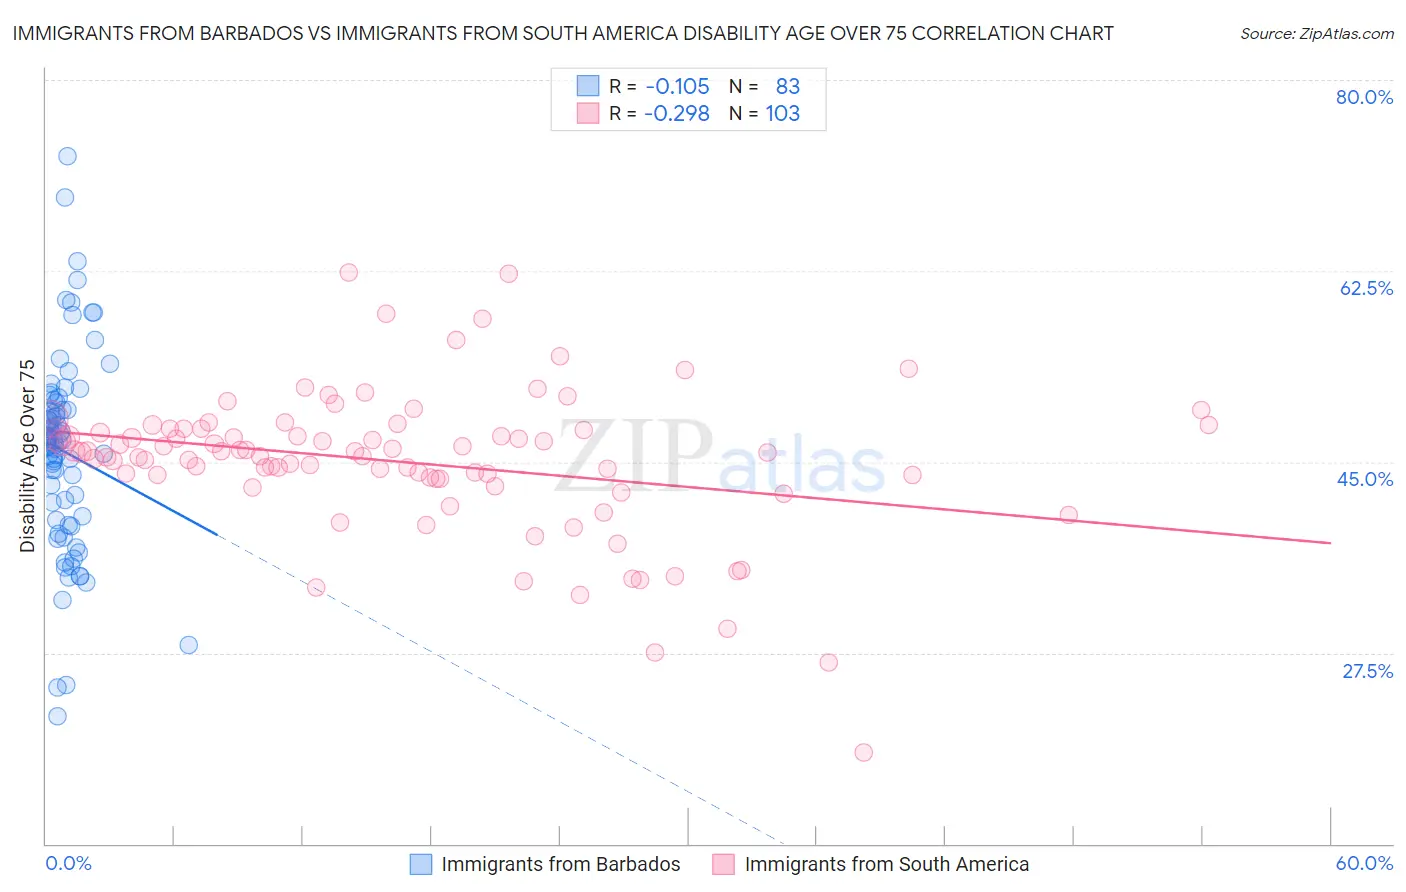
Immigrants from Barbados vs Immigrants from South America Disability Age Over 75 Correlation Chart
The statistical analysis conducted on geographies consisting of 112,754,830 people shows a poor negative correlation between the proportion of Immigrants from Barbados and percentage of population with a disability over the age of 75 in the United States with a correlation coefficient (R) of -0.105 and weighted average of 47.9%. Similarly, the statistical analysis conducted on geographies consisting of 485,170,882 people shows a weak negative correlation between the proportion of Immigrants from South America and percentage of population with a disability over the age of 75 in the United States with a correlation coefficient (R) of -0.298 and weighted average of 46.7%, a difference of 2.6%.
Disability Age Over 75 Correlation Summary
| Measurement | Immigrants from Barbados | Immigrants from South America |
| Minimum | 21.7% | 18.4% |
| Maximum | 73.0% | 62.4% |
| Range | 51.3% | 44.0% |
| Mean | 45.9% | 45.0% |
| Median | 46.8% | 45.9% |
| Interquartile 25% (IQ1) | 39.6% | 43.4% |
| Interquartile 75% (IQ3) | 50.4% | 48.0% |
| Interquartile Range (IQR) | 10.8% | 4.6% |
| Standard Deviation (Sample) | 9.2% | 6.8% |
| Standard Deviation (Population) | 9.1% | 6.7% |
Similar Demographics by Disability Age Over 75
Demographics Similar to Immigrants from Barbados by Disability Age Over 75
In terms of disability age over 75, the demographic groups most similar to Immigrants from Barbados are Senegalese (47.9%, a difference of 0.0%), Immigrants from Panama (47.9%, a difference of 0.030%), Laotian (47.9%, a difference of 0.040%), Panamanian (47.9%, a difference of 0.060%), and Immigrants from Burma/Myanmar (47.9%, a difference of 0.060%).
| Demographics | Rating | Rank | Disability Age Over 75 |
| Immigrants | Syria | 17.4 /100 | #207 | Poor 47.8% |
| Immigrants | Senegal | 16.9 /100 | #208 | Poor 47.8% |
| Immigrants | Indonesia | 14.2 /100 | #209 | Poor 47.8% |
| Vietnamese | 11.9 /100 | #210 | Poor 47.9% |
| Panamanians | 11.8 /100 | #211 | Poor 47.9% |
| Immigrants | Burma/Myanmar | 11.7 /100 | #212 | Poor 47.9% |
| Laotians | 11.5 /100 | #213 | Poor 47.9% |
| Immigrants | Barbados | 10.7 /100 | #214 | Poor 47.9% |
| Senegalese | 10.7 /100 | #215 | Poor 47.9% |
| Immigrants | Panama | 10.2 /100 | #216 | Poor 47.9% |
| Immigrants | Grenada | 9.4 /100 | #217 | Tragic 47.9% |
| Immigrants | Western Africa | 8.3 /100 | #218 | Tragic 48.0% |
| Immigrants | Western Asia | 7.5 /100 | #219 | Tragic 48.0% |
| Bahamians | 7.4 /100 | #220 | Tragic 48.0% |
| Immigrants | Oceania | 7.3 /100 | #221 | Tragic 48.0% |
Demographics Similar to Immigrants from South America by Disability Age Over 75
In terms of disability age over 75, the demographic groups most similar to Immigrants from South America are Colombian (46.7%, a difference of 0.030%), European (46.7%, a difference of 0.040%), Syrian (46.7%, a difference of 0.050%), Immigrants from Colombia (46.7%, a difference of 0.060%), and Icelander (46.7%, a difference of 0.060%).
| Demographics | Rating | Rank | Disability Age Over 75 |
| Hungarians | 95.3 /100 | #117 | Exceptional 46.5% |
| Czechoslovakians | 94.7 /100 | #118 | Exceptional 46.6% |
| Canadians | 94.4 /100 | #119 | Exceptional 46.6% |
| Immigrants | Nepal | 94.1 /100 | #120 | Exceptional 46.6% |
| Scandinavians | 93.6 /100 | #121 | Exceptional 46.6% |
| Immigrants | Albania | 93.2 /100 | #122 | Exceptional 46.6% |
| Immigrants | Colombia | 92.6 /100 | #123 | Exceptional 46.7% |
| Immigrants | South America | 91.8 /100 | #124 | Exceptional 46.7% |
| Colombians | 91.3 /100 | #125 | Exceptional 46.7% |
| Europeans | 91.2 /100 | #126 | Exceptional 46.7% |
| Syrians | 91.1 /100 | #127 | Exceptional 46.7% |
| Icelanders | 90.9 /100 | #128 | Exceptional 46.7% |
| Immigrants | Germany | 90.8 /100 | #129 | Exceptional 46.7% |
| Immigrants | Northern Africa | 90.7 /100 | #130 | Exceptional 46.7% |
| Scottish | 90.5 /100 | #131 | Exceptional 46.7% |