Indian (Asian) vs Syrian Disability Age 35 to 64
COMPARE
Indian (Asian)
Syrian
Disability Age 35 to 64
Disability Age 35 to 64 Comparison
Indians (Asian)
Syrians
8.9%
DISABILITY AGE 35 TO 64
100.0/ 100
METRIC RATING
12th/ 347
METRIC RANK
11.0%
DISABILITY AGE 35 TO 64
79.8/ 100
METRIC RATING
150th/ 347
METRIC RANK
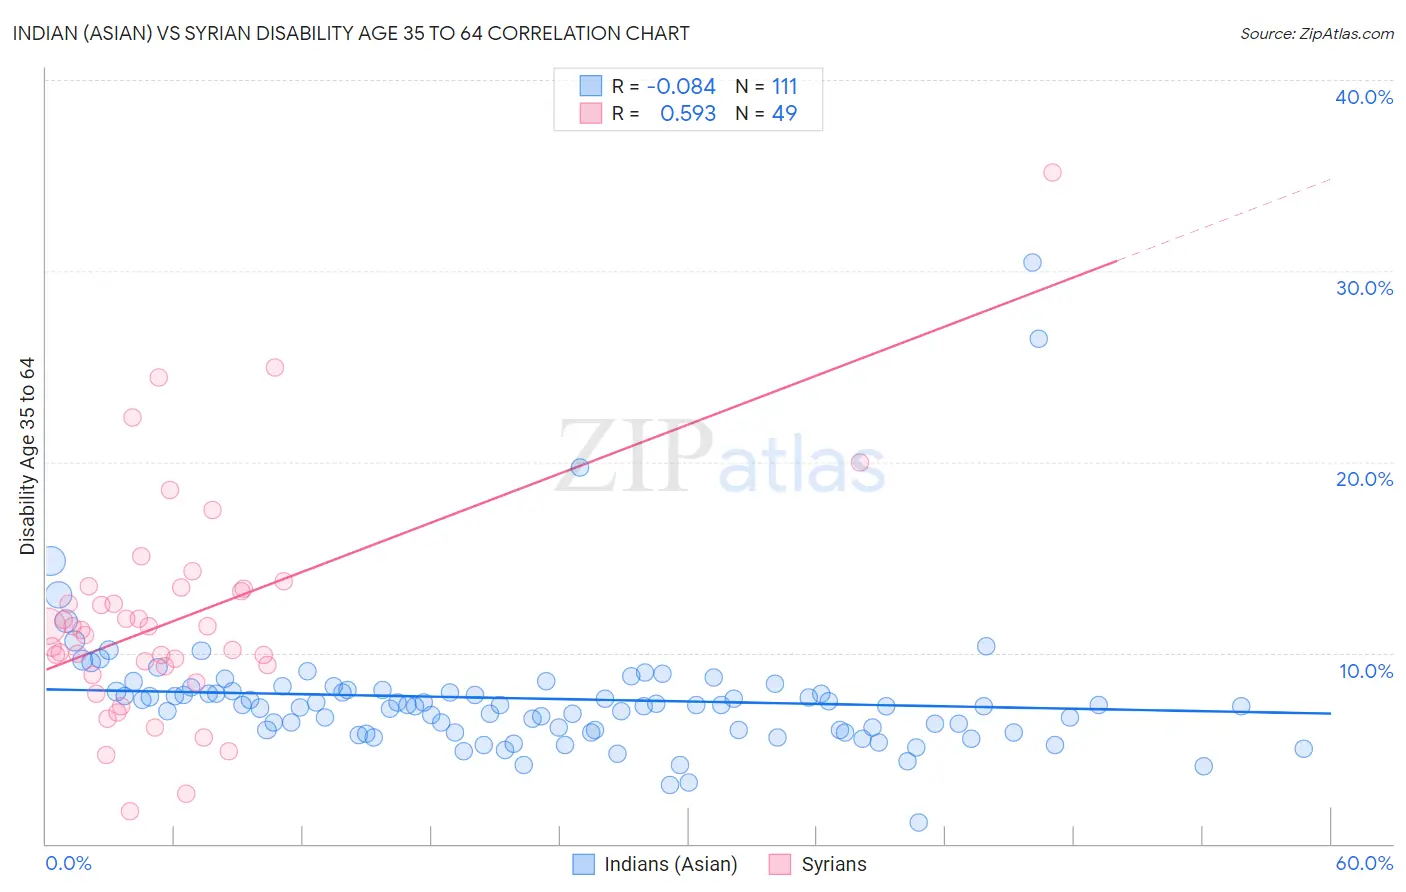
Indian (Asian) vs Syrian Disability Age 35 to 64 Correlation Chart
The statistical analysis conducted on geographies consisting of 494,627,255 people shows a slight negative correlation between the proportion of Indians (Asian) and percentage of population with a disability between the ages 34 and 64 in the United States with a correlation coefficient (R) of -0.084 and weighted average of 8.9%. Similarly, the statistical analysis conducted on geographies consisting of 266,185,136 people shows a substantial positive correlation between the proportion of Syrians and percentage of population with a disability between the ages 34 and 64 in the United States with a correlation coefficient (R) of 0.593 and weighted average of 11.0%, a difference of 23.8%.
Disability Age 35 to 64 Correlation Summary
| Measurement | Indian (Asian) | Syrian |
| Minimum | 1.1% | 1.7% |
| Maximum | 30.4% | 35.1% |
| Range | 29.3% | 33.5% |
| Mean | 7.6% | 11.8% |
| Median | 7.3% | 11.2% |
| Interquartile 25% (IQ1) | 5.9% | 9.1% |
| Interquartile 75% (IQ3) | 8.0% | 13.4% |
| Interquartile Range (IQR) | 2.1% | 4.3% |
| Standard Deviation (Sample) | 3.6% | 5.9% |
| Standard Deviation (Population) | 3.6% | 5.8% |
Similar Demographics by Disability Age 35 to 64
Demographics Similar to Indians (Asian) by Disability Age 35 to 64
In terms of disability age 35 to 64, the demographic groups most similar to Indians (Asian) are Immigrants from South Central Asia (8.9%, a difference of 0.090%), Immigrants from Singapore (8.9%, a difference of 0.69%), Immigrants from Eastern Asia (8.8%, a difference of 0.78%), Bolivian (8.9%, a difference of 0.98%), and Immigrants from Korea (9.0%, a difference of 1.3%).
| Demographics | Rating | Rank | Disability Age 35 to 64 |
| Immigrants | Iran | 100.0 /100 | #5 | Exceptional 8.5% |
| Thais | 100.0 /100 | #6 | Exceptional 8.6% |
| Immigrants | Israel | 100.0 /100 | #7 | Exceptional 8.6% |
| Iranians | 100.0 /100 | #8 | Exceptional 8.7% |
| Immigrants | China | 100.0 /100 | #9 | Exceptional 8.7% |
| Immigrants | Bolivia | 100.0 /100 | #10 | Exceptional 8.7% |
| Immigrants | Eastern Asia | 100.0 /100 | #11 | Exceptional 8.8% |
| Indians (Asian) | 100.0 /100 | #12 | Exceptional 8.9% |
| Immigrants | South Central Asia | 100.0 /100 | #13 | Exceptional 8.9% |
| Immigrants | Singapore | 100.0 /100 | #14 | Exceptional 8.9% |
| Bolivians | 100.0 /100 | #15 | Exceptional 8.9% |
| Immigrants | Korea | 100.0 /100 | #16 | Exceptional 9.0% |
| Burmese | 100.0 /100 | #17 | Exceptional 9.2% |
| Soviet Union | 100.0 /100 | #18 | Exceptional 9.2% |
| Immigrants | Venezuela | 100.0 /100 | #19 | Exceptional 9.3% |
Demographics Similar to Syrians by Disability Age 35 to 64
In terms of disability age 35 to 64, the demographic groups most similar to Syrians are New Zealander (11.0%, a difference of 0.060%), Immigrants from Cameroon (10.9%, a difference of 0.17%), Ukrainian (11.0%, a difference of 0.22%), Immigrants from England (11.0%, a difference of 0.30%), and Immigrants from Canada (11.0%, a difference of 0.38%).
| Demographics | Rating | Rank | Disability Age 35 to 64 |
| Sierra Leoneans | 89.7 /100 | #143 | Excellent 10.8% |
| Lithuanians | 88.7 /100 | #144 | Excellent 10.8% |
| Immigrants | Bangladesh | 85.6 /100 | #145 | Excellent 10.9% |
| South American Indians | 83.5 /100 | #146 | Excellent 10.9% |
| Immigrants | Eritrea | 83.4 /100 | #147 | Excellent 10.9% |
| Arabs | 82.7 /100 | #148 | Excellent 10.9% |
| Immigrants | Cameroon | 81.1 /100 | #149 | Excellent 10.9% |
| Syrians | 79.8 /100 | #150 | Good 11.0% |
| New Zealanders | 79.3 /100 | #151 | Good 11.0% |
| Ukrainians | 78.0 /100 | #152 | Good 11.0% |
| Immigrants | England | 77.4 /100 | #153 | Good 11.0% |
| Immigrants | Canada | 76.7 /100 | #154 | Good 11.0% |
| Moroccans | 76.4 /100 | #155 | Good 11.0% |
| Immigrants | Sierra Leone | 76.2 /100 | #156 | Good 11.0% |
| Guyanese | 75.1 /100 | #157 | Good 11.0% |