Immigrants from Yemen vs Immigrants from Austria Disability Age 35 to 64
COMPARE
Immigrants from Yemen
Immigrants from Austria
Disability Age 35 to 64
Disability Age 35 to 64 Comparison
Immigrants from Yemen
Immigrants from Austria
14.0%
DISABILITY AGE 35 TO 64
0.0/ 100
METRIC RATING
306th/ 347
METRIC RANK
10.4%
DISABILITY AGE 35 TO 64
97.8/ 100
METRIC RATING
104th/ 347
METRIC RANK
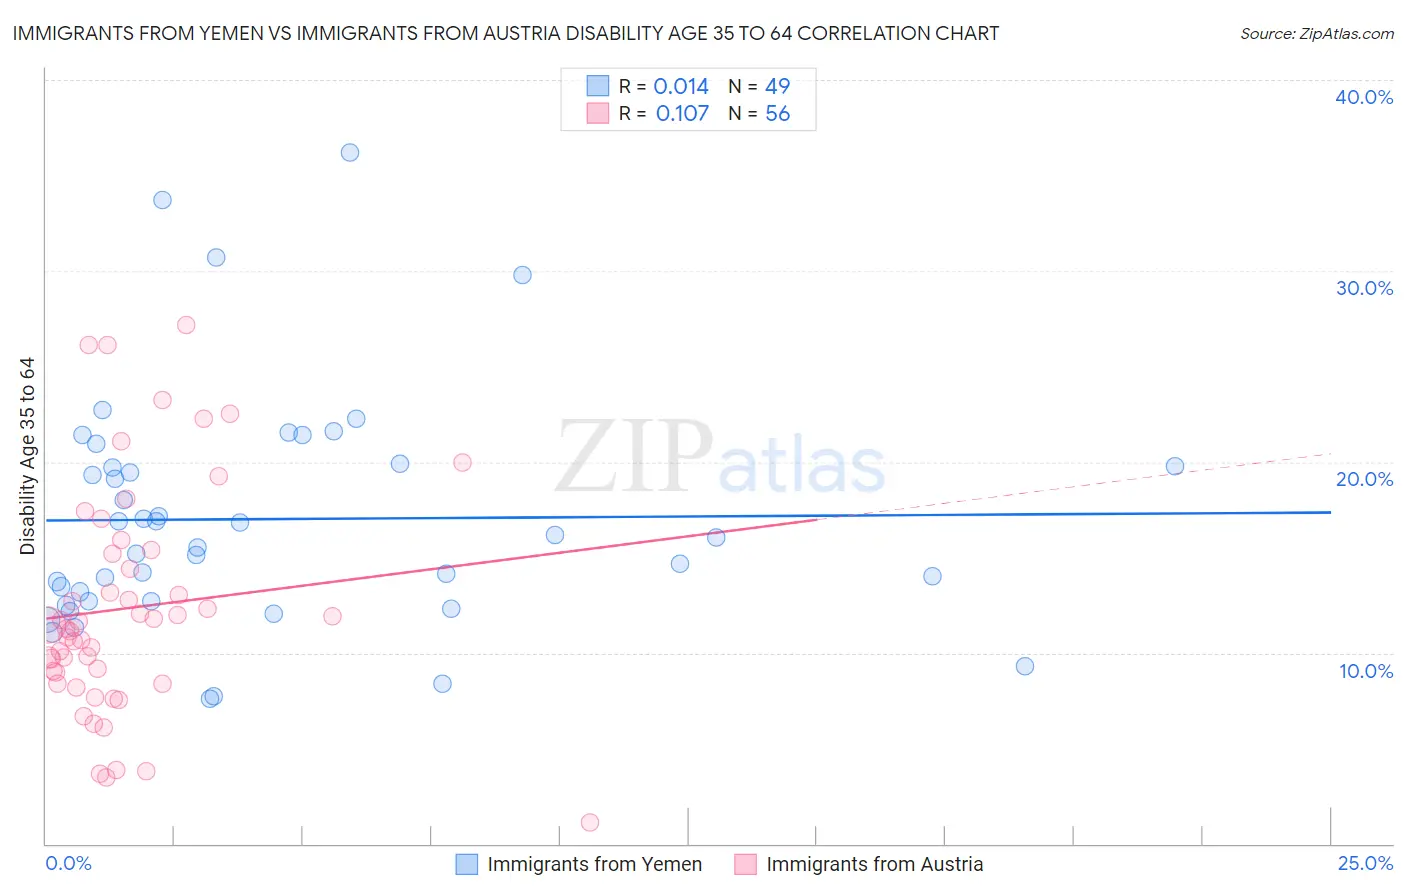
Immigrants from Yemen vs Immigrants from Austria Disability Age 35 to 64 Correlation Chart
The statistical analysis conducted on geographies consisting of 82,432,584 people shows no correlation between the proportion of Immigrants from Yemen and percentage of population with a disability between the ages 34 and 64 in the United States with a correlation coefficient (R) of 0.014 and weighted average of 14.0%. Similarly, the statistical analysis conducted on geographies consisting of 167,953,043 people shows a poor positive correlation between the proportion of Immigrants from Austria and percentage of population with a disability between the ages 34 and 64 in the United States with a correlation coefficient (R) of 0.107 and weighted average of 10.4%, a difference of 34.8%.
Disability Age 35 to 64 Correlation Summary
| Measurement | Immigrants from Yemen | Immigrants from Austria |
| Minimum | 7.6% | 1.1% |
| Maximum | 36.2% | 27.1% |
| Range | 28.6% | 26.0% |
| Mean | 17.0% | 12.3% |
| Median | 16.0% | 11.4% |
| Interquartile 25% (IQ1) | 12.7% | 8.7% |
| Interquartile 75% (IQ3) | 19.8% | 15.3% |
| Interquartile Range (IQR) | 7.1% | 6.6% |
| Standard Deviation (Sample) | 6.1% | 6.0% |
| Standard Deviation (Population) | 6.1% | 5.9% |
Similar Demographics by Disability Age 35 to 64
Demographics Similar to Immigrants from Yemen by Disability Age 35 to 64
In terms of disability age 35 to 64, the demographic groups most similar to Immigrants from Yemen are Blackfeet (14.1%, a difference of 0.16%), Inupiat (14.1%, a difference of 0.19%), Cree (14.1%, a difference of 0.26%), Cape Verdean (14.1%, a difference of 0.73%), and American (13.9%, a difference of 0.87%).
| Demographics | Rating | Rank | Disability Age 35 to 64 |
| Spanish Americans | 0.0 /100 | #299 | Tragic 13.7% |
| Delaware | 0.0 /100 | #300 | Tragic 13.7% |
| French American Indians | 0.0 /100 | #301 | Tragic 13.7% |
| Aleuts | 0.0 /100 | #302 | Tragic 13.8% |
| Sioux | 0.0 /100 | #303 | Tragic 13.9% |
| Hopi | 0.0 /100 | #304 | Tragic 13.9% |
| Americans | 0.0 /100 | #305 | Tragic 13.9% |
| Immigrants | Yemen | 0.0 /100 | #306 | Tragic 14.0% |
| Blackfeet | 0.0 /100 | #307 | Tragic 14.1% |
| Inupiat | 0.0 /100 | #308 | Tragic 14.1% |
| Cree | 0.0 /100 | #309 | Tragic 14.1% |
| Cape Verdeans | 0.0 /100 | #310 | Tragic 14.1% |
| Immigrants | Azores | 0.0 /100 | #311 | Tragic 14.3% |
| Paiute | 0.0 /100 | #312 | Tragic 14.3% |
| Iroquois | 0.0 /100 | #313 | Tragic 14.4% |
Demographics Similar to Immigrants from Austria by Disability Age 35 to 64
In terms of disability age 35 to 64, the demographic groups most similar to Immigrants from Austria are Macedonian (10.4%, a difference of 0.020%), Immigrants from Ukraine (10.4%, a difference of 0.14%), Immigrants from Western Asia (10.4%, a difference of 0.17%), Immigrants from Hungary (10.4%, a difference of 0.17%), and Immigrants from Philippines (10.4%, a difference of 0.23%).
| Demographics | Rating | Rank | Disability Age 35 to 64 |
| Immigrants | Denmark | 98.4 /100 | #97 | Exceptional 10.3% |
| Immigrants | Uruguay | 98.3 /100 | #98 | Exceptional 10.3% |
| Palestinians | 98.2 /100 | #99 | Exceptional 10.4% |
| Immigrants | Jordan | 98.1 /100 | #100 | Exceptional 10.4% |
| Immigrants | Philippines | 98.0 /100 | #101 | Exceptional 10.4% |
| Immigrants | Western Asia | 98.0 /100 | #102 | Exceptional 10.4% |
| Immigrants | Ukraine | 97.9 /100 | #103 | Exceptional 10.4% |
| Immigrants | Austria | 97.8 /100 | #104 | Exceptional 10.4% |
| Macedonians | 97.8 /100 | #105 | Exceptional 10.4% |
| Immigrants | Hungary | 97.6 /100 | #106 | Exceptional 10.4% |
| Zimbabweans | 97.4 /100 | #107 | Exceptional 10.4% |
| Ethiopians | 97.4 /100 | #108 | Exceptional 10.5% |
| Immigrants | Ethiopia | 97.2 /100 | #109 | Exceptional 10.5% |
| Koreans | 97.1 /100 | #110 | Exceptional 10.5% |
| Brazilians | 96.9 /100 | #111 | Exceptional 10.5% |