Immigrants from Western Europe vs Cape Verdean Female Disability
COMPARE
Immigrants from Western Europe
Cape Verdean
Female Disability
Female Disability Comparison
Immigrants from Western Europe
Cape Verdeans
12.2%
FEMALE DISABILITY
40.9/ 100
METRIC RATING
178th/ 347
METRIC RANK
14.2%
FEMALE DISABILITY
0.0/ 100
METRIC RATING
328th/ 347
METRIC RANK
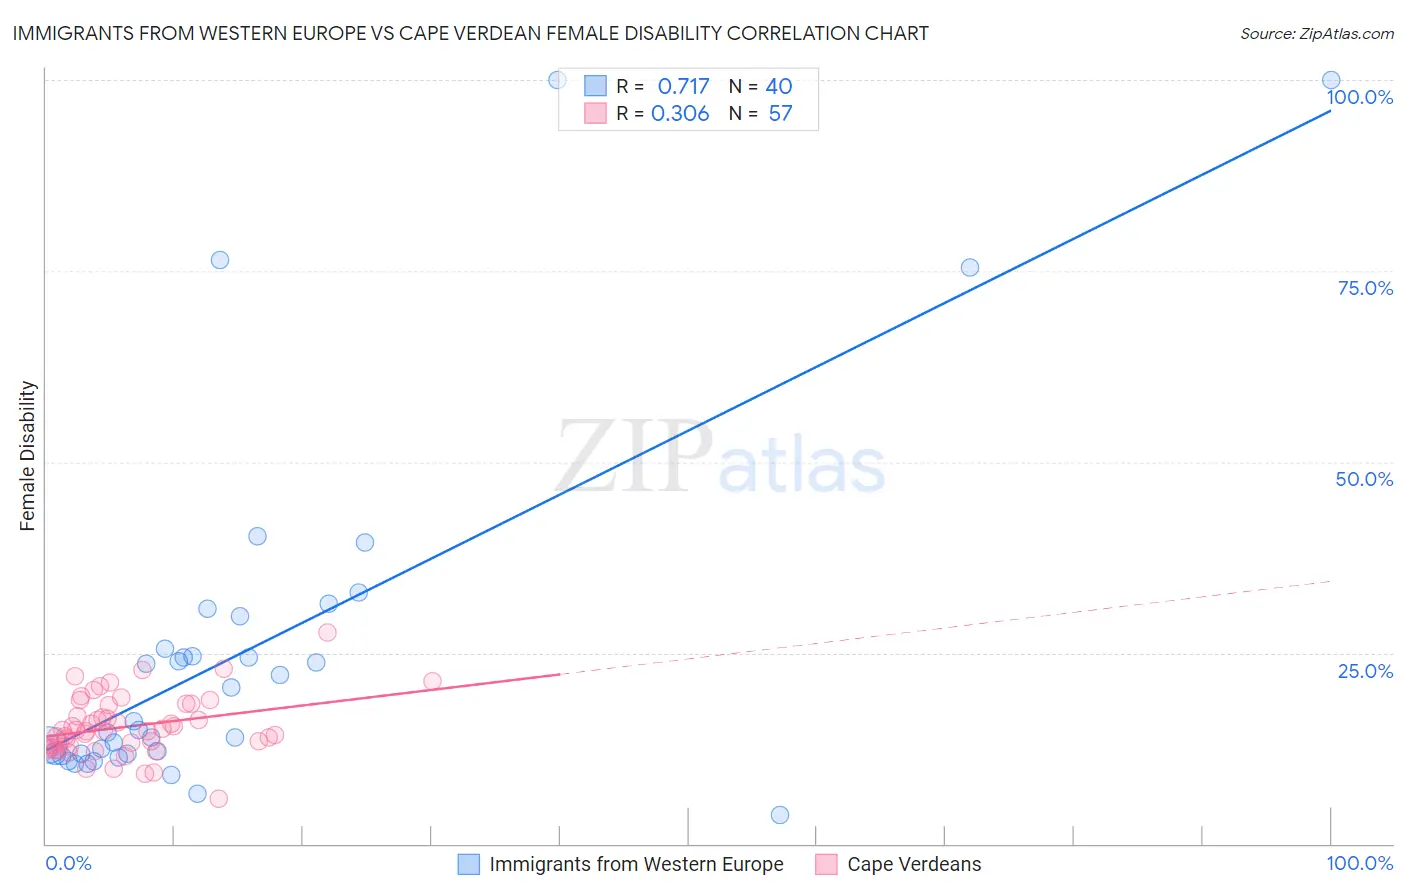
Immigrants from Western Europe vs Cape Verdean Female Disability Correlation Chart
The statistical analysis conducted on geographies consisting of 494,007,860 people shows a strong positive correlation between the proportion of Immigrants from Western Europe and percentage of females with a disability in the United States with a correlation coefficient (R) of 0.717 and weighted average of 12.2%. Similarly, the statistical analysis conducted on geographies consisting of 107,562,752 people shows a mild positive correlation between the proportion of Cape Verdeans and percentage of females with a disability in the United States with a correlation coefficient (R) of 0.306 and weighted average of 14.2%, a difference of 16.4%.
Female Disability Correlation Summary
| Measurement | Immigrants from Western Europe | Cape Verdean |
| Minimum | 3.8% | 5.9% |
| Maximum | 100.0% | 27.7% |
| Range | 96.2% | 21.8% |
| Mean | 25.3% | 15.4% |
| Median | 15.5% | 14.8% |
| Interquartile 25% (IQ1) | 11.8% | 12.7% |
| Interquartile 75% (IQ3) | 27.7% | 18.3% |
| Interquartile Range (IQR) | 15.9% | 5.6% |
| Standard Deviation (Sample) | 23.2% | 3.9% |
| Standard Deviation (Population) | 22.9% | 3.9% |
Similar Demographics by Female Disability
Demographics Similar to Immigrants from Western Europe by Female Disability
In terms of female disability, the demographic groups most similar to Immigrants from Western Europe are Immigrants from Ghana (12.2%, a difference of 0.060%), Immigrants from Guyana (12.2%, a difference of 0.080%), Immigrants from Fiji (12.3%, a difference of 0.11%), Albanian (12.3%, a difference of 0.12%), and Immigrants from Canada (12.3%, a difference of 0.15%).
| Demographics | Rating | Rank | Female Disability |
| Immigrants | Southern Europe | 56.3 /100 | #171 | Average 12.2% |
| Haitians | 51.9 /100 | #172 | Average 12.2% |
| Immigrants | Mexico | 50.8 /100 | #173 | Average 12.2% |
| Immigrants | England | 50.0 /100 | #174 | Average 12.2% |
| Immigrants | St. Vincent and the Grenadines | 49.7 /100 | #175 | Average 12.2% |
| Immigrants | Guyana | 43.1 /100 | #176 | Average 12.2% |
| Immigrants | Ghana | 42.5 /100 | #177 | Average 12.2% |
| Immigrants | Western Europe | 40.9 /100 | #178 | Average 12.2% |
| Immigrants | Fiji | 38.2 /100 | #179 | Fair 12.3% |
| Albanians | 37.9 /100 | #180 | Fair 12.3% |
| Immigrants | Canada | 37.2 /100 | #181 | Fair 12.3% |
| Norwegians | 36.9 /100 | #182 | Fair 12.3% |
| Cubans | 36.5 /100 | #183 | Fair 12.3% |
| Iraqis | 36.0 /100 | #184 | Fair 12.3% |
| Immigrants | Uzbekistan | 33.9 /100 | #185 | Fair 12.3% |
Demographics Similar to Cape Verdeans by Female Disability
In terms of female disability, the demographic groups most similar to Cape Verdeans are Ottawa (14.2%, a difference of 0.0%), Osage (14.3%, a difference of 0.43%), Comanche (14.2%, a difference of 0.44%), Navajo (14.2%, a difference of 0.55%), and Native/Alaskan (14.1%, a difference of 0.69%).
| Demographics | Rating | Rank | Female Disability |
| Potawatomi | 0.0 /100 | #321 | Tragic 14.1% |
| Pueblo | 0.0 /100 | #322 | Tragic 14.1% |
| Blacks/African Americans | 0.0 /100 | #323 | Tragic 14.1% |
| Natives/Alaskans | 0.0 /100 | #324 | Tragic 14.1% |
| Navajo | 0.0 /100 | #325 | Tragic 14.2% |
| Comanche | 0.0 /100 | #326 | Tragic 14.2% |
| Ottawa | 0.0 /100 | #327 | Tragic 14.2% |
| Cape Verdeans | 0.0 /100 | #328 | Tragic 14.2% |
| Osage | 0.0 /100 | #329 | Tragic 14.3% |
| Yuman | 0.0 /100 | #330 | Tragic 14.5% |
| Immigrants | Cabo Verde | 0.0 /100 | #331 | Tragic 14.6% |
| Pima | 0.0 /100 | #332 | Tragic 14.8% |
| Immigrants | Azores | 0.0 /100 | #333 | Tragic 14.9% |
| Cherokee | 0.0 /100 | #334 | Tragic 14.9% |
| Cajuns | 0.0 /100 | #335 | Tragic 14.9% |