Immigrants from Western Asia vs Burmese Vision Disability
COMPARE
Immigrants from Western Asia
Burmese
Vision Disability
Vision Disability Comparison
Immigrants from Western Asia
Burmese
2.0%
VISION DISABILITY
97.5/ 100
METRIC RATING
83rd/ 347
METRIC RANK
1.8%
VISION DISABILITY
100.0/ 100
METRIC RATING
17th/ 347
METRIC RANK
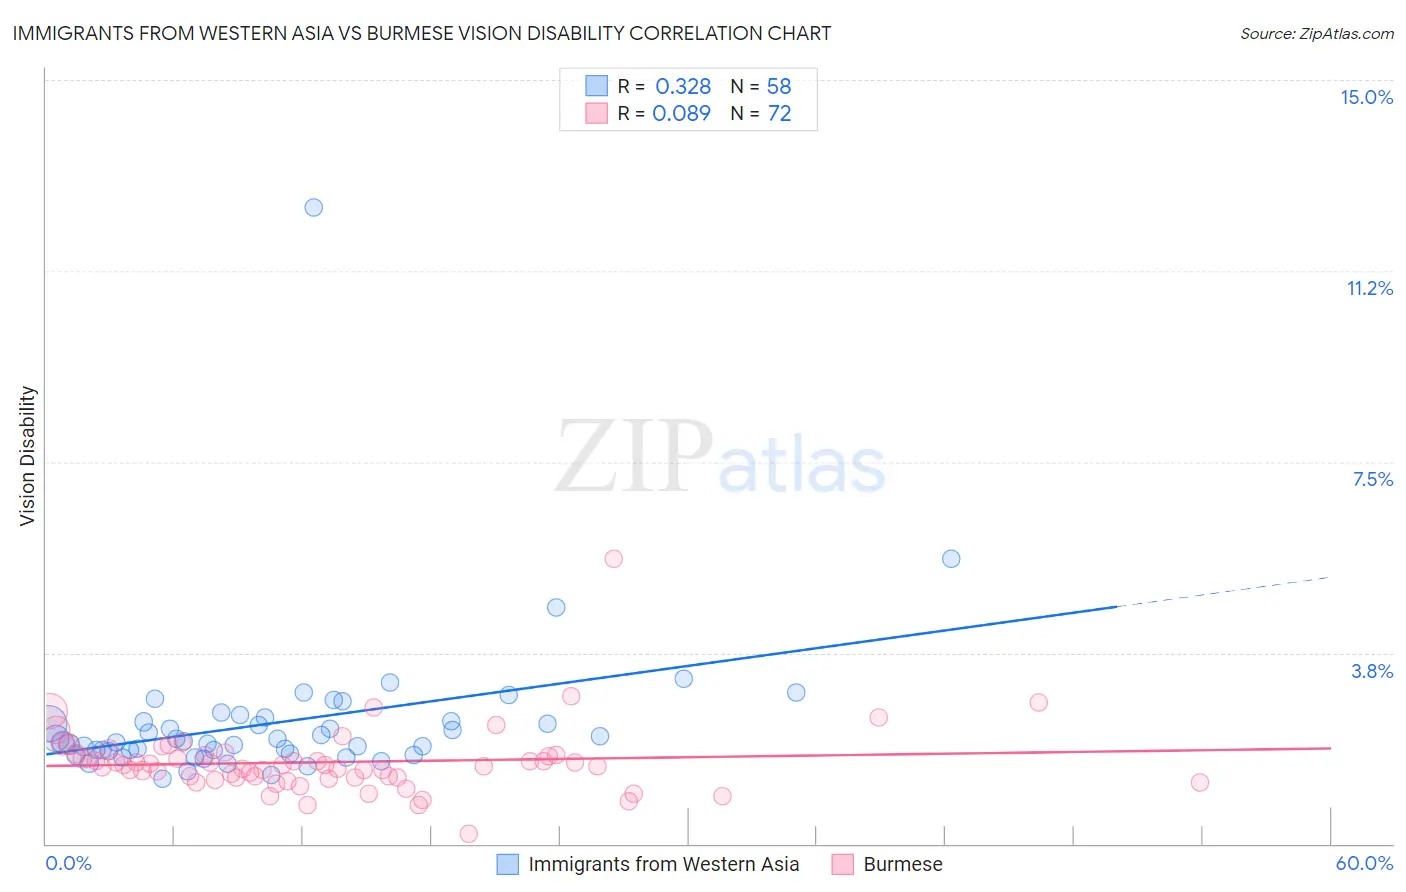
Immigrants from Western Asia vs Burmese Vision Disability Correlation Chart
The statistical analysis conducted on geographies consisting of 404,140,331 people shows a mild positive correlation between the proportion of Immigrants from Western Asia and percentage of population with vision disability in the United States with a correlation coefficient (R) of 0.328 and weighted average of 2.0%. Similarly, the statistical analysis conducted on geographies consisting of 464,767,032 people shows a slight positive correlation between the proportion of Burmese and percentage of population with vision disability in the United States with a correlation coefficient (R) of 0.089 and weighted average of 1.8%, a difference of 10.4%.
Vision Disability Correlation Summary
| Measurement | Immigrants from Western Asia | Burmese |
| Minimum | 1.3% | 0.21% |
| Maximum | 12.5% | 5.6% |
| Range | 11.2% | 5.4% |
| Mean | 2.4% | 1.6% |
| Median | 2.0% | 1.5% |
| Interquartile 25% (IQ1) | 1.8% | 1.3% |
| Interquartile 75% (IQ3) | 2.4% | 1.7% |
| Interquartile Range (IQR) | 0.59% | 0.43% |
| Standard Deviation (Sample) | 1.5% | 0.68% |
| Standard Deviation (Population) | 1.5% | 0.67% |
Similar Demographics by Vision Disability
Demographics Similar to Immigrants from Western Asia by Vision Disability
In terms of vision disability, the demographic groups most similar to Immigrants from Western Asia are Immigrants from Poland (2.0%, a difference of 0.080%), Soviet Union (2.0%, a difference of 0.11%), Immigrants from Latvia (2.0%, a difference of 0.12%), Lithuanian (2.0%, a difference of 0.17%), and Chinese (2.0%, a difference of 0.17%).
| Demographics | Rating | Rank | Vision Disability |
| Paraguayans | 98.3 /100 | #76 | Exceptional 2.0% |
| Immigrants | Jordan | 98.3 /100 | #77 | Exceptional 2.0% |
| Immigrants | Eastern Europe | 98.3 /100 | #78 | Exceptional 2.0% |
| Assyrians/Chaldeans/Syriacs | 98.1 /100 | #79 | Exceptional 2.0% |
| Lithuanians | 97.7 /100 | #80 | Exceptional 2.0% |
| Soviet Union | 97.6 /100 | #81 | Exceptional 2.0% |
| Immigrants | Poland | 97.6 /100 | #82 | Exceptional 2.0% |
| Immigrants | Western Asia | 97.5 /100 | #83 | Exceptional 2.0% |
| Immigrants | Latvia | 97.3 /100 | #84 | Exceptional 2.0% |
| Chinese | 97.2 /100 | #85 | Exceptional 2.0% |
| Immigrants | Moldova | 97.2 /100 | #86 | Exceptional 2.0% |
| Immigrants | Switzerland | 97.0 /100 | #87 | Exceptional 2.0% |
| Norwegians | 97.0 /100 | #88 | Exceptional 2.0% |
| Immigrants | Eastern Africa | 97.0 /100 | #89 | Exceptional 2.0% |
| Immigrants | Lebanon | 96.7 /100 | #90 | Exceptional 2.1% |
Demographics Similar to Burmese by Vision Disability
In terms of vision disability, the demographic groups most similar to Burmese are Indian (Asian) (1.8%, a difference of 0.010%), Bolivian (1.9%, a difference of 0.42%), Immigrants from Bolivia (1.8%, a difference of 0.45%), Immigrants from China (1.8%, a difference of 0.87%), and Immigrants from Eastern Asia (1.8%, a difference of 1.0%).
| Demographics | Rating | Rank | Vision Disability |
| Immigrants | Hong Kong | 100.0 /100 | #10 | Exceptional 1.8% |
| Immigrants | Israel | 100.0 /100 | #11 | Exceptional 1.8% |
| Immigrants | Korea | 100.0 /100 | #12 | Exceptional 1.8% |
| Immigrants | Eastern Asia | 100.0 /100 | #13 | Exceptional 1.8% |
| Immigrants | China | 100.0 /100 | #14 | Exceptional 1.8% |
| Immigrants | Bolivia | 100.0 /100 | #15 | Exceptional 1.8% |
| Indians (Asian) | 100.0 /100 | #16 | Exceptional 1.8% |
| Burmese | 100.0 /100 | #17 | Exceptional 1.8% |
| Bolivians | 100.0 /100 | #18 | Exceptional 1.9% |
| Immigrants | Sri Lanka | 100.0 /100 | #19 | Exceptional 1.9% |
| Asians | 100.0 /100 | #20 | Exceptional 1.9% |
| Turks | 100.0 /100 | #21 | Exceptional 1.9% |
| Immigrants | Pakistan | 100.0 /100 | #22 | Exceptional 1.9% |
| Immigrants | Asia | 99.9 /100 | #23 | Exceptional 1.9% |
| Immigrants | Lithuania | 99.9 /100 | #24 | Exceptional 1.9% |