Immigrants from Western Asia vs Bangladeshi Disability Age Over 75
COMPARE
Immigrants from Western Asia
Bangladeshi
Disability Age Over 75
Disability Age Over 75 Comparison
Immigrants from Western Asia
Bangladeshis
48.0%
DISABILITY AGE OVER 75
7.5/ 100
METRIC RATING
219th/ 347
METRIC RANK
49.4%
DISABILITY AGE OVER 75
0.0/ 100
METRIC RATING
280th/ 347
METRIC RANK
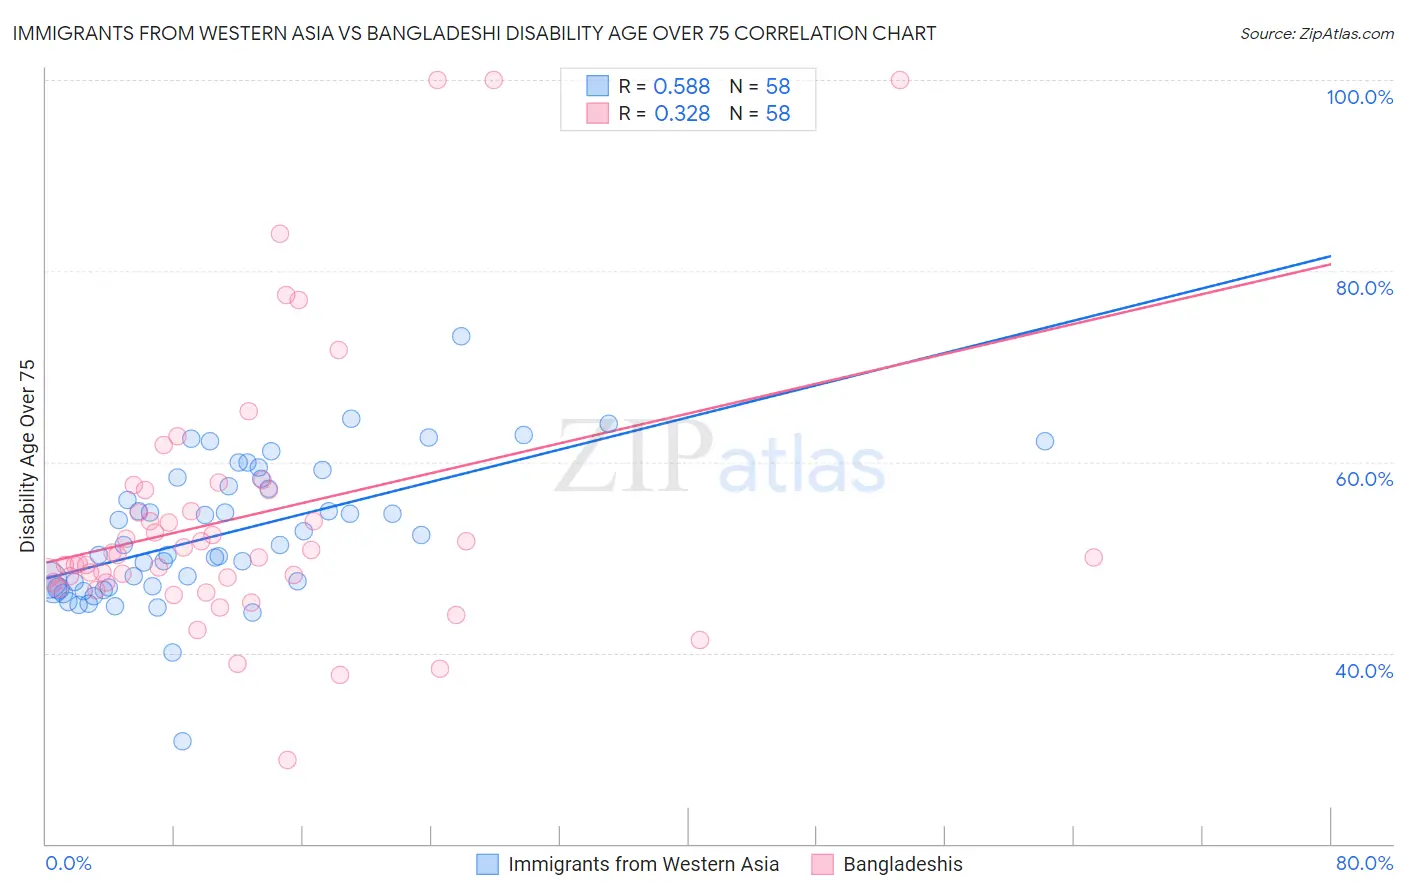
Immigrants from Western Asia vs Bangladeshi Disability Age Over 75 Correlation Chart
The statistical analysis conducted on geographies consisting of 403,829,975 people shows a substantial positive correlation between the proportion of Immigrants from Western Asia and percentage of population with a disability over the age of 75 in the United States with a correlation coefficient (R) of 0.588 and weighted average of 48.0%. Similarly, the statistical analysis conducted on geographies consisting of 141,101,779 people shows a mild positive correlation between the proportion of Bangladeshis and percentage of population with a disability over the age of 75 in the United States with a correlation coefficient (R) of 0.328 and weighted average of 49.4%, a difference of 2.9%.
Disability Age Over 75 Correlation Summary
| Measurement | Immigrants from Western Asia | Bangladeshi |
| Minimum | 30.8% | 28.8% |
| Maximum | 73.1% | 100.0% |
| Range | 42.3% | 71.2% |
| Mean | 52.5% | 54.2% |
| Median | 51.3% | 50.1% |
| Interquartile 25% (IQ1) | 46.9% | 47.4% |
| Interquartile 75% (IQ3) | 58.2% | 57.1% |
| Interquartile Range (IQR) | 11.3% | 9.7% |
| Standard Deviation (Sample) | 7.3% | 14.3% |
| Standard Deviation (Population) | 7.3% | 14.2% |
Similar Demographics by Disability Age Over 75
Demographics Similar to Immigrants from Western Asia by Disability Age Over 75
In terms of disability age over 75, the demographic groups most similar to Immigrants from Western Asia are Bahamian (48.0%, a difference of 0.010%), Immigrants from Oceania (48.0%, a difference of 0.010%), Immigrants from Western Africa (48.0%, a difference of 0.060%), Barbadian (48.0%, a difference of 0.060%), and Immigrants from Bangladesh (48.0%, a difference of 0.060%).
| Demographics | Rating | Rank | Disability Age Over 75 |
| Immigrants | Burma/Myanmar | 11.7 /100 | #212 | Poor 47.9% |
| Laotians | 11.5 /100 | #213 | Poor 47.9% |
| Immigrants | Barbados | 10.7 /100 | #214 | Poor 47.9% |
| Senegalese | 10.7 /100 | #215 | Poor 47.9% |
| Immigrants | Panama | 10.2 /100 | #216 | Poor 47.9% |
| Immigrants | Grenada | 9.4 /100 | #217 | Tragic 47.9% |
| Immigrants | Western Africa | 8.3 /100 | #218 | Tragic 48.0% |
| Immigrants | Western Asia | 7.5 /100 | #219 | Tragic 48.0% |
| Bahamians | 7.4 /100 | #220 | Tragic 48.0% |
| Immigrants | Oceania | 7.3 /100 | #221 | Tragic 48.0% |
| Barbadians | 6.8 /100 | #222 | Tragic 48.0% |
| Immigrants | Bangladesh | 6.8 /100 | #223 | Tragic 48.0% |
| Liberians | 6.7 /100 | #224 | Tragic 48.0% |
| Spanish | 6.5 /100 | #225 | Tragic 48.0% |
| Immigrants | Nonimmigrants | 6.5 /100 | #226 | Tragic 48.0% |
Demographics Similar to Bangladeshis by Disability Age Over 75
In terms of disability age over 75, the demographic groups most similar to Bangladeshis are Belizean (49.4%, a difference of 0.0%), Guamanian/Chamorro (49.4%, a difference of 0.060%), Black/African American (49.5%, a difference of 0.15%), Samoan (49.5%, a difference of 0.17%), and Immigrants from Latin America (49.5%, a difference of 0.23%).
| Demographics | Rating | Rank | Disability Age Over 75 |
| Immigrants | Iraq | 0.1 /100 | #273 | Tragic 49.1% |
| Immigrants | Guatemala | 0.1 /100 | #274 | Tragic 49.1% |
| Immigrants | Dominica | 0.1 /100 | #275 | Tragic 49.1% |
| Immigrants | Uzbekistan | 0.1 /100 | #276 | Tragic 49.2% |
| Hawaiians | 0.1 /100 | #277 | Tragic 49.2% |
| Immigrants | Laos | 0.1 /100 | #278 | Tragic 49.2% |
| Guamanians/Chamorros | 0.0 /100 | #279 | Tragic 49.4% |
| Bangladeshis | 0.0 /100 | #280 | Tragic 49.4% |
| Belizeans | 0.0 /100 | #281 | Tragic 49.4% |
| Blacks/African Americans | 0.0 /100 | #282 | Tragic 49.5% |
| Samoans | 0.0 /100 | #283 | Tragic 49.5% |
| Immigrants | Latin America | 0.0 /100 | #284 | Tragic 49.5% |
| Crow | 0.0 /100 | #285 | Tragic 49.6% |
| Immigrants | Belize | 0.0 /100 | #286 | Tragic 49.6% |
| Sioux | 0.0 /100 | #287 | Tragic 49.7% |