Immigrants from Venezuela vs Immigrants from Eastern Asia Seniors Poverty Over the Age of 75
COMPARE
Immigrants from Venezuela
Immigrants from Eastern Asia
Seniors Poverty Over the Age of 75
Seniors Poverty Over the Age of 75 Comparison
Immigrants from Venezuela
Immigrants from Eastern Asia
14.3%
SENIORS POVERTY OVER THE AGE OF 75
0.0/ 100
METRIC RATING
269th/ 347
METRIC RANK
12.8%
SENIORS POVERTY OVER THE AGE OF 75
8.4/ 100
METRIC RATING
208th/ 347
METRIC RANK
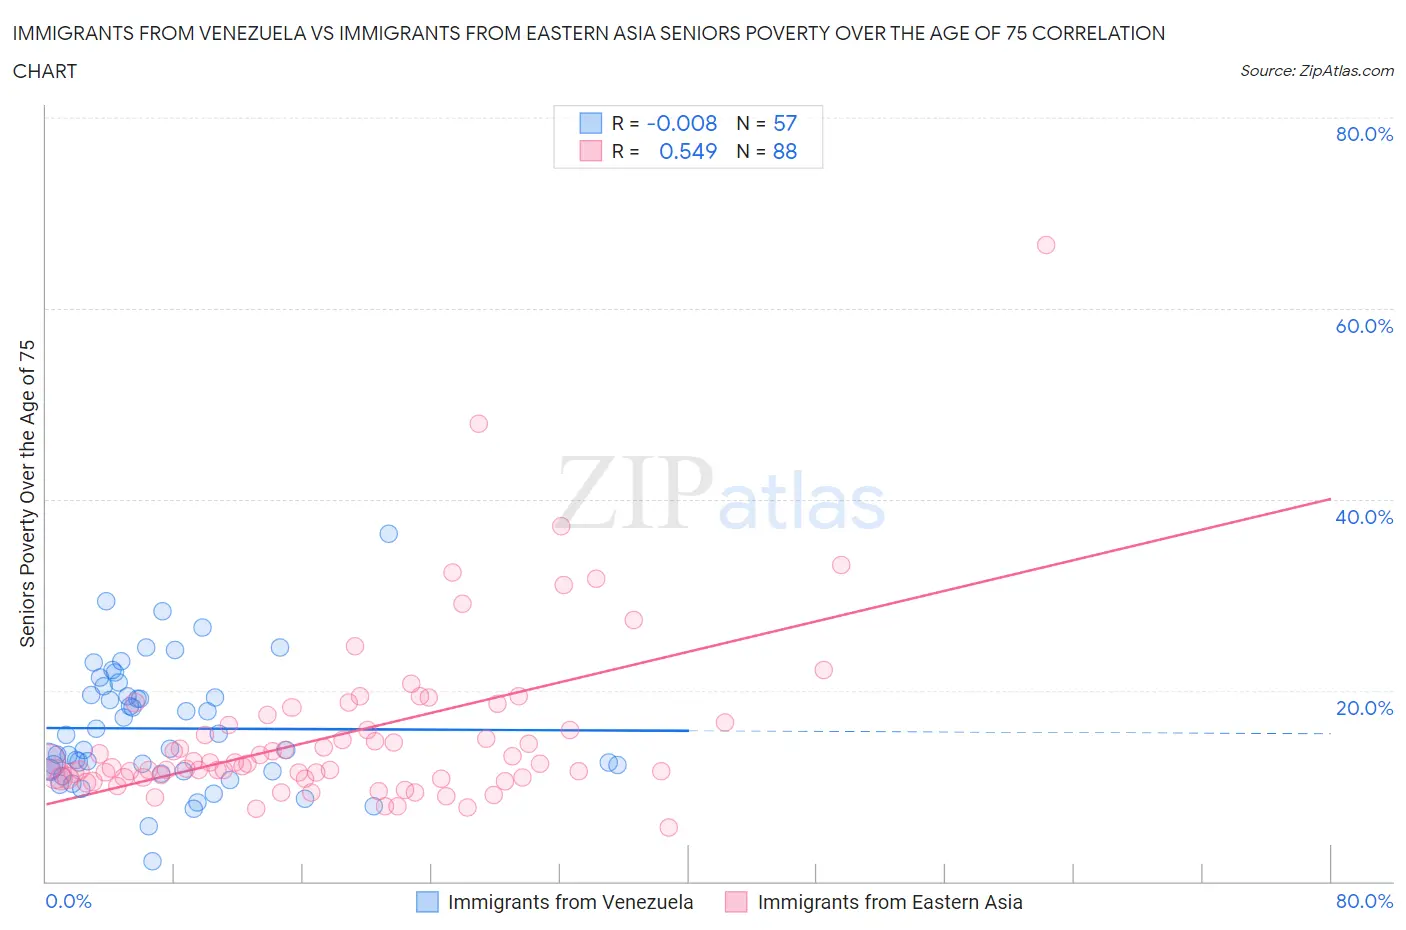
Immigrants from Venezuela vs Immigrants from Eastern Asia Seniors Poverty Over the Age of 75 Correlation Chart
The statistical analysis conducted on geographies consisting of 285,680,828 people shows no correlation between the proportion of Immigrants from Venezuela and poverty level among seniors over the age of 75 in the United States with a correlation coefficient (R) of -0.008 and weighted average of 14.3%. Similarly, the statistical analysis conducted on geographies consisting of 490,572,947 people shows a substantial positive correlation between the proportion of Immigrants from Eastern Asia and poverty level among seniors over the age of 75 in the United States with a correlation coefficient (R) of 0.549 and weighted average of 12.8%, a difference of 11.7%.
Seniors Poverty Over the Age of 75 Correlation Summary
| Measurement | Immigrants from Venezuela | Immigrants from Eastern Asia |
| Minimum | 2.1% | 5.7% |
| Maximum | 36.4% | 66.7% |
| Range | 34.3% | 61.0% |
| Mean | 16.0% | 15.4% |
| Median | 13.8% | 12.3% |
| Interquartile 25% (IQ1) | 11.5% | 10.9% |
| Interquartile 75% (IQ3) | 19.9% | 16.5% |
| Interquartile Range (IQR) | 8.4% | 5.6% |
| Standard Deviation (Sample) | 6.5% | 9.0% |
| Standard Deviation (Population) | 6.4% | 9.0% |
Similar Demographics by Seniors Poverty Over the Age of 75
Demographics Similar to Immigrants from Venezuela by Seniors Poverty Over the Age of 75
In terms of seniors poverty over the age of 75, the demographic groups most similar to Immigrants from Venezuela are Colombian (14.3%, a difference of 0.11%), Immigrants from Uruguay (14.3%, a difference of 0.14%), Venezuelan (14.2%, a difference of 0.46%), Armenian (14.2%, a difference of 0.47%), and Immigrants from Ghana (14.4%, a difference of 0.62%).
| Demographics | Rating | Rank | Seniors Poverty Over the Age of 75 |
| Cajuns | 0.1 /100 | #262 | Tragic 14.0% |
| Iroquois | 0.1 /100 | #263 | Tragic 14.0% |
| South Americans | 0.0 /100 | #264 | Tragic 14.1% |
| Salvadorans | 0.0 /100 | #265 | Tragic 14.2% |
| Armenians | 0.0 /100 | #266 | Tragic 14.2% |
| Venezuelans | 0.0 /100 | #267 | Tragic 14.2% |
| Colombians | 0.0 /100 | #268 | Tragic 14.3% |
| Immigrants | Venezuela | 0.0 /100 | #269 | Tragic 14.3% |
| Immigrants | Uruguay | 0.0 /100 | #270 | Tragic 14.3% |
| Immigrants | Ghana | 0.0 /100 | #271 | Tragic 14.4% |
| Mexicans | 0.0 /100 | #272 | Tragic 14.4% |
| Immigrants | South America | 0.0 /100 | #273 | Tragic 14.4% |
| Immigrants | Bahamas | 0.0 /100 | #274 | Tragic 14.4% |
| Immigrants | El Salvador | 0.0 /100 | #275 | Tragic 14.5% |
| Soviet Union | 0.0 /100 | #276 | Tragic 14.5% |
Demographics Similar to Immigrants from Eastern Asia by Seniors Poverty Over the Age of 75
In terms of seniors poverty over the age of 75, the demographic groups most similar to Immigrants from Eastern Asia are Costa Rican (12.8%, a difference of 0.080%), Albanian (12.7%, a difference of 0.28%), Immigrants from Liberia (12.8%, a difference of 0.28%), Indian (Asian) (12.7%, a difference of 0.32%), and Comanche (12.8%, a difference of 0.38%).
| Demographics | Rating | Rank | Seniors Poverty Over the Age of 75 |
| Paraguayans | 11.1 /100 | #201 | Poor 12.7% |
| Arapaho | 10.9 /100 | #202 | Poor 12.7% |
| Immigrants | Southern Europe | 10.7 /100 | #203 | Poor 12.7% |
| Immigrants | Eritrea | 10.5 /100 | #204 | Poor 12.7% |
| Indians (Asian) | 9.7 /100 | #205 | Tragic 12.7% |
| Albanians | 9.6 /100 | #206 | Tragic 12.7% |
| Costa Ricans | 8.7 /100 | #207 | Tragic 12.8% |
| Immigrants | Eastern Asia | 8.4 /100 | #208 | Tragic 12.8% |
| Immigrants | Liberia | 7.3 /100 | #209 | Tragic 12.8% |
| Comanche | 7.0 /100 | #210 | Tragic 12.8% |
| Brazilians | 6.9 /100 | #211 | Tragic 12.8% |
| Immigrants | Hong Kong | 6.5 /100 | #212 | Tragic 12.8% |
| French American Indians | 6.1 /100 | #213 | Tragic 12.9% |
| Immigrants | Africa | 5.9 /100 | #214 | Tragic 12.9% |
| South American Indians | 5.5 /100 | #215 | Tragic 12.9% |