Immigrants from Uruguay vs Malaysian Female Disability
COMPARE
Immigrants from Uruguay
Malaysian
Female Disability
Female Disability Comparison
Immigrants from Uruguay
Malaysians
11.7%
FEMALE DISABILITY
98.5/ 100
METRIC RATING
100th/ 347
METRIC RANK
12.5%
FEMALE DISABILITY
5.0/ 100
METRIC RATING
235th/ 347
METRIC RANK
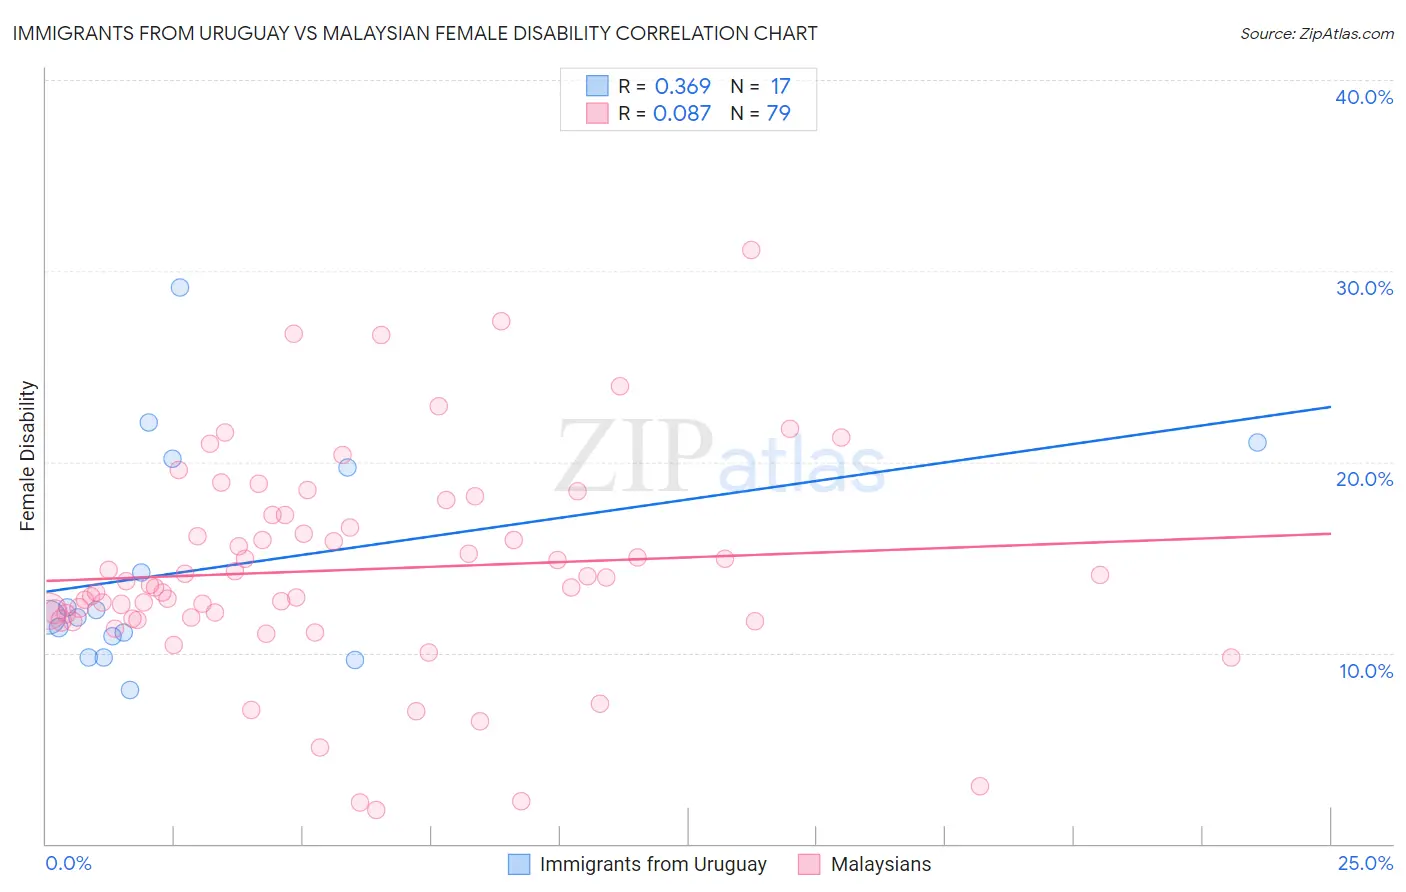
Immigrants from Uruguay vs Malaysian Female Disability Correlation Chart
The statistical analysis conducted on geographies consisting of 133,256,548 people shows a mild positive correlation between the proportion of Immigrants from Uruguay and percentage of females with a disability in the United States with a correlation coefficient (R) of 0.369 and weighted average of 11.7%. Similarly, the statistical analysis conducted on geographies consisting of 226,065,175 people shows a slight positive correlation between the proportion of Malaysians and percentage of females with a disability in the United States with a correlation coefficient (R) of 0.087 and weighted average of 12.5%, a difference of 7.0%.
Female Disability Correlation Summary
| Measurement | Immigrants from Uruguay | Malaysian |
| Minimum | 8.0% | 1.8% |
| Maximum | 29.1% | 31.1% |
| Range | 21.1% | 29.3% |
| Mean | 14.4% | 14.3% |
| Median | 11.9% | 13.5% |
| Interquartile 25% (IQ1) | 10.3% | 11.8% |
| Interquartile 75% (IQ3) | 19.9% | 17.2% |
| Interquartile Range (IQR) | 9.6% | 5.4% |
| Standard Deviation (Sample) | 5.8% | 5.5% |
| Standard Deviation (Population) | 5.6% | 5.5% |
Similar Demographics by Female Disability
Demographics Similar to Immigrants from Uruguay by Female Disability
In terms of female disability, the demographic groups most similar to Immigrants from Uruguay are Immigrants from Costa Rica (11.7%, a difference of 0.020%), Immigrants from South Eastern Asia (11.7%, a difference of 0.030%), Immigrants from Philippines (11.7%, a difference of 0.050%), Immigrants from Eastern Africa (11.7%, a difference of 0.10%), and Immigrants from Western Asia (11.7%, a difference of 0.11%).
| Demographics | Rating | Rank | Female Disability |
| Immigrants | Sierra Leone | 99.4 /100 | #93 | Exceptional 11.6% |
| Immigrants | Brazil | 99.4 /100 | #94 | Exceptional 11.6% |
| Immigrants | Northern Europe | 99.4 /100 | #95 | Exceptional 11.6% |
| Immigrants | Russia | 99.0 /100 | #96 | Exceptional 11.7% |
| Koreans | 99.0 /100 | #97 | Exceptional 11.7% |
| Uruguayans | 98.8 /100 | #98 | Exceptional 11.7% |
| Immigrants | Philippines | 98.6 /100 | #99 | Exceptional 11.7% |
| Immigrants | Uruguay | 98.5 /100 | #100 | Exceptional 11.7% |
| Immigrants | Costa Rica | 98.4 /100 | #101 | Exceptional 11.7% |
| Immigrants | South Eastern Asia | 98.4 /100 | #102 | Exceptional 11.7% |
| Immigrants | Eastern Africa | 98.3 /100 | #103 | Exceptional 11.7% |
| Immigrants | Western Asia | 98.3 /100 | #104 | Exceptional 11.7% |
| Australians | 98.3 /100 | #105 | Exceptional 11.7% |
| Immigrants | Greece | 98.2 /100 | #106 | Exceptional 11.7% |
| Latvians | 98.2 /100 | #107 | Exceptional 11.7% |
Demographics Similar to Malaysians by Female Disability
In terms of female disability, the demographic groups most similar to Malaysians are Scandinavian (12.5%, a difference of 0.050%), Immigrants from Iraq (12.5%, a difference of 0.060%), Immigrants from West Indies (12.6%, a difference of 0.13%), Immigrants from Somalia (12.5%, a difference of 0.17%), and Belgian (12.5%, a difference of 0.25%).
| Demographics | Rating | Rank | Female Disability |
| Immigrants | Cambodia | 7.8 /100 | #228 | Tragic 12.5% |
| Hungarians | 7.2 /100 | #229 | Tragic 12.5% |
| Immigrants | Belize | 7.0 /100 | #230 | Tragic 12.5% |
| Belgians | 6.5 /100 | #231 | Tragic 12.5% |
| Immigrants | Somalia | 5.9 /100 | #232 | Tragic 12.5% |
| Immigrants | Iraq | 5.3 /100 | #233 | Tragic 12.5% |
| Scandinavians | 5.3 /100 | #234 | Tragic 12.5% |
| Malaysians | 5.0 /100 | #235 | Tragic 12.5% |
| Immigrants | West Indies | 4.4 /100 | #236 | Tragic 12.6% |
| Slavs | 3.8 /100 | #237 | Tragic 12.6% |
| Yugoslavians | 3.7 /100 | #238 | Tragic 12.6% |
| Barbadians | 3.6 /100 | #239 | Tragic 12.6% |
| German Russians | 3.2 /100 | #240 | Tragic 12.6% |
| Japanese | 2.7 /100 | #241 | Tragic 12.6% |
| Canadians | 2.6 /100 | #242 | Tragic 12.6% |