Immigrants from Trinidad and Tobago vs Somali Ambulatory Disability
COMPARE
Immigrants from Trinidad and Tobago
Somali
Ambulatory Disability
Ambulatory Disability Comparison
Immigrants from Trinidad and Tobago
Somalis
6.7%
AMBULATORY DISABILITY
0.1/ 100
METRIC RATING
271st/ 347
METRIC RANK
5.7%
AMBULATORY DISABILITY
99.2/ 100
METRIC RATING
78th/ 347
METRIC RANK
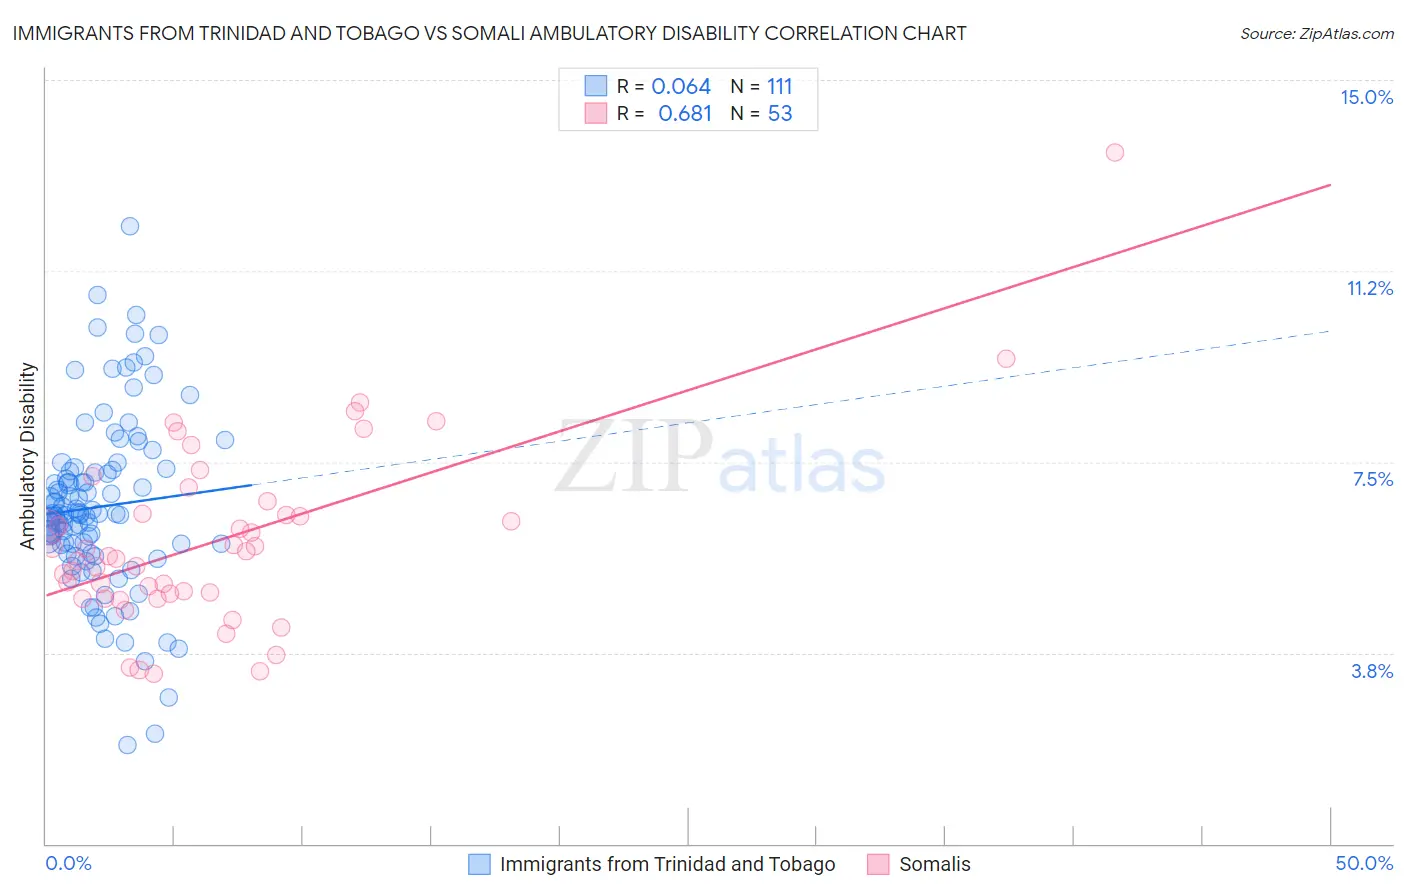
Immigrants from Trinidad and Tobago vs Somali Ambulatory Disability Correlation Chart
The statistical analysis conducted on geographies consisting of 223,483,943 people shows a slight positive correlation between the proportion of Immigrants from Trinidad and Tobago and percentage of population with ambulatory disability in the United States with a correlation coefficient (R) of 0.064 and weighted average of 6.7%. Similarly, the statistical analysis conducted on geographies consisting of 99,294,852 people shows a significant positive correlation between the proportion of Somalis and percentage of population with ambulatory disability in the United States with a correlation coefficient (R) of 0.681 and weighted average of 5.7%, a difference of 16.5%.
Ambulatory Disability Correlation Summary
| Measurement | Immigrants from Trinidad and Tobago | Somali |
| Minimum | 1.9% | 3.3% |
| Maximum | 12.1% | 13.6% |
| Range | 10.2% | 10.2% |
| Mean | 6.6% | 6.0% |
| Median | 6.5% | 5.7% |
| Interquartile 25% (IQ1) | 5.7% | 4.9% |
| Interquartile 75% (IQ3) | 7.3% | 6.6% |
| Interquartile Range (IQR) | 1.6% | 1.7% |
| Standard Deviation (Sample) | 1.7% | 1.8% |
| Standard Deviation (Population) | 1.7% | 1.8% |
Similar Demographics by Ambulatory Disability
Demographics Similar to Immigrants from Trinidad and Tobago by Ambulatory Disability
In terms of ambulatory disability, the demographic groups most similar to Immigrants from Trinidad and Tobago are Slovak (6.7%, a difference of 0.10%), French (6.6%, a difference of 0.26%), French Canadian (6.7%, a difference of 0.36%), White/Caucasian (6.7%, a difference of 0.38%), and Spanish (6.6%, a difference of 0.56%).
| Demographics | Rating | Rank | Ambulatory Disability |
| Nepalese | 0.2 /100 | #264 | Tragic 6.6% |
| Bahamians | 0.2 /100 | #265 | Tragic 6.6% |
| Guyanese | 0.2 /100 | #266 | Tragic 6.6% |
| Trinidadians and Tobagonians | 0.2 /100 | #267 | Tragic 6.6% |
| Spanish | 0.2 /100 | #268 | Tragic 6.6% |
| French | 0.1 /100 | #269 | Tragic 6.6% |
| Slovaks | 0.1 /100 | #270 | Tragic 6.7% |
| Immigrants | Trinidad and Tobago | 0.1 /100 | #271 | Tragic 6.7% |
| French Canadians | 0.1 /100 | #272 | Tragic 6.7% |
| Whites/Caucasians | 0.1 /100 | #273 | Tragic 6.7% |
| Sioux | 0.1 /100 | #274 | Tragic 6.7% |
| Immigrants | Guyana | 0.1 /100 | #275 | Tragic 6.7% |
| Celtics | 0.1 /100 | #276 | Tragic 6.7% |
| Jamaicans | 0.1 /100 | #277 | Tragic 6.7% |
| Immigrants | West Indies | 0.1 /100 | #278 | Tragic 6.7% |
Demographics Similar to Somalis by Ambulatory Disability
In terms of ambulatory disability, the demographic groups most similar to Somalis are Immigrants from Vietnam (5.7%, a difference of 0.010%), Chilean (5.7%, a difference of 0.010%), Immigrants from Ireland (5.7%, a difference of 0.14%), Immigrants from Jordan (5.7%, a difference of 0.14%), and Palestinian (5.7%, a difference of 0.15%).
| Demographics | Rating | Rank | Ambulatory Disability |
| Immigrants | Peru | 99.4 /100 | #71 | Exceptional 5.7% |
| Brazilians | 99.4 /100 | #72 | Exceptional 5.7% |
| Immigrants | Northern Africa | 99.4 /100 | #73 | Exceptional 5.7% |
| Immigrants | Cameroon | 99.4 /100 | #74 | Exceptional 5.7% |
| Immigrants | South Africa | 99.3 /100 | #75 | Exceptional 5.7% |
| Sudanese | 99.3 /100 | #76 | Exceptional 5.7% |
| Immigrants | Vietnam | 99.3 /100 | #77 | Exceptional 5.7% |
| Somalis | 99.2 /100 | #78 | Exceptional 5.7% |
| Chileans | 99.2 /100 | #79 | Exceptional 5.7% |
| Immigrants | Ireland | 99.2 /100 | #80 | Exceptional 5.7% |
| Immigrants | Jordan | 99.2 /100 | #81 | Exceptional 5.7% |
| Palestinians | 99.2 /100 | #82 | Exceptional 5.7% |
| Eastern Europeans | 99.2 /100 | #83 | Exceptional 5.7% |
| Ugandans | 99.2 /100 | #84 | Exceptional 5.7% |
| South Americans | 99.0 /100 | #85 | Exceptional 5.7% |