Immigrants from Switzerland vs Crow Disability Age Over 75
COMPARE
Immigrants from Switzerland
Crow
Disability Age Over 75
Disability Age Over 75 Comparison
Immigrants from Switzerland
Crow
45.3%
DISABILITY AGE OVER 75
99.9/ 100
METRIC RATING
23rd/ 347
METRIC RANK
49.6%
DISABILITY AGE OVER 75
0.0/ 100
METRIC RATING
285th/ 347
METRIC RANK
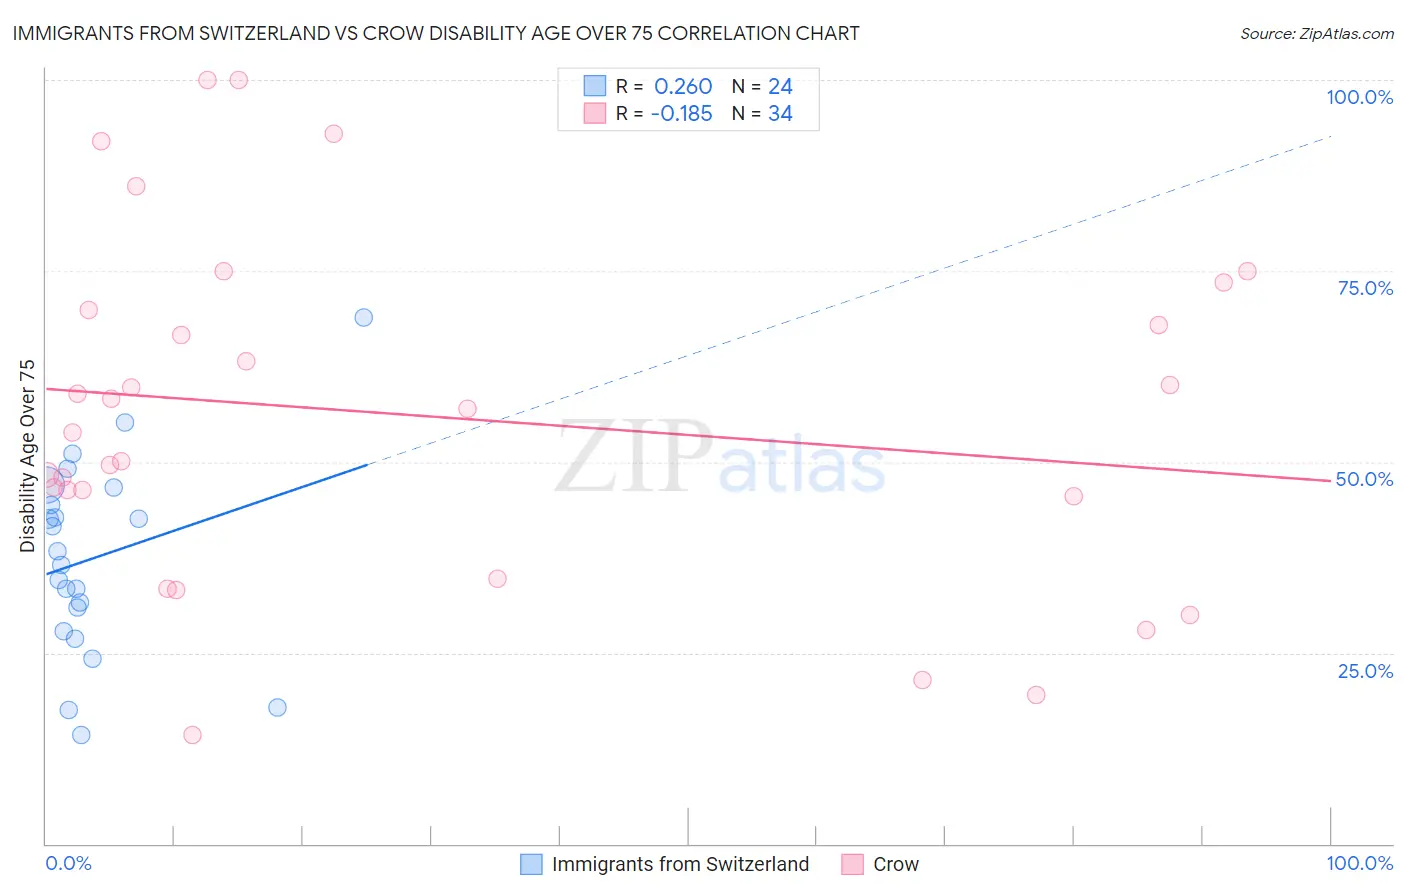
Immigrants from Switzerland vs Crow Disability Age Over 75 Correlation Chart
The statistical analysis conducted on geographies consisting of 148,038,506 people shows a weak positive correlation between the proportion of Immigrants from Switzerland and percentage of population with a disability over the age of 75 in the United States with a correlation coefficient (R) of 0.260 and weighted average of 45.3%. Similarly, the statistical analysis conducted on geographies consisting of 59,157,590 people shows a poor negative correlation between the proportion of Crow and percentage of population with a disability over the age of 75 in the United States with a correlation coefficient (R) of -0.185 and weighted average of 49.6%, a difference of 9.4%.
Disability Age Over 75 Correlation Summary
| Measurement | Immigrants from Switzerland | Crow |
| Minimum | 14.3% | 14.3% |
| Maximum | 69.0% | 100.0% |
| Range | 54.7% | 85.7% |
| Mean | 37.5% | 56.0% |
| Median | 37.5% | 55.4% |
| Interquartile 25% (IQ1) | 29.4% | 45.5% |
| Interquartile 75% (IQ3) | 45.5% | 69.9% |
| Interquartile Range (IQR) | 16.1% | 24.4% |
| Standard Deviation (Sample) | 12.8% | 22.6% |
| Standard Deviation (Population) | 12.5% | 22.2% |
Similar Demographics by Disability Age Over 75
Demographics Similar to Immigrants from Switzerland by Disability Age Over 75
In terms of disability age over 75, the demographic groups most similar to Immigrants from Switzerland are Polish (45.3%, a difference of 0.020%), Immigrants from South Africa (45.3%, a difference of 0.030%), Immigrants from Belgium (45.3%, a difference of 0.060%), Immigrants from Bolivia (45.4%, a difference of 0.070%), and Macedonian (45.4%, a difference of 0.10%).
| Demographics | Rating | Rank | Disability Age Over 75 |
| Immigrants | Northern Europe | 100.0 /100 | #16 | Exceptional 45.2% |
| Immigrants | India | 100.0 /100 | #17 | Exceptional 45.2% |
| Bolivians | 100.0 /100 | #18 | Exceptional 45.2% |
| Immigrants | Greece | 100.0 /100 | #19 | Exceptional 45.2% |
| Immigrants | Serbia | 100.0 /100 | #20 | Exceptional 45.3% |
| Immigrants | Belgium | 100.0 /100 | #21 | Exceptional 45.3% |
| Immigrants | South Africa | 100.0 /100 | #22 | Exceptional 45.3% |
| Immigrants | Switzerland | 99.9 /100 | #23 | Exceptional 45.3% |
| Poles | 99.9 /100 | #24 | Exceptional 45.3% |
| Immigrants | Bolivia | 99.9 /100 | #25 | Exceptional 45.4% |
| Macedonians | 99.9 /100 | #26 | Exceptional 45.4% |
| Immigrants | Poland | 99.9 /100 | #27 | Exceptional 45.4% |
| Thais | 99.9 /100 | #28 | Exceptional 45.4% |
| Filipinos | 99.9 /100 | #29 | Exceptional 45.4% |
| Immigrants | Denmark | 99.9 /100 | #30 | Exceptional 45.4% |
Demographics Similar to Crow by Disability Age Over 75
In terms of disability age over 75, the demographic groups most similar to Crow are Immigrants from Belize (49.6%, a difference of 0.080%), Immigrants from Latin America (49.5%, a difference of 0.13%), Samoan (49.5%, a difference of 0.19%), Black/African American (49.5%, a difference of 0.21%), and Sioux (49.7%, a difference of 0.29%).
| Demographics | Rating | Rank | Disability Age Over 75 |
| Immigrants | Laos | 0.1 /100 | #278 | Tragic 49.2% |
| Guamanians/Chamorros | 0.0 /100 | #279 | Tragic 49.4% |
| Bangladeshis | 0.0 /100 | #280 | Tragic 49.4% |
| Belizeans | 0.0 /100 | #281 | Tragic 49.4% |
| Blacks/African Americans | 0.0 /100 | #282 | Tragic 49.5% |
| Samoans | 0.0 /100 | #283 | Tragic 49.5% |
| Immigrants | Latin America | 0.0 /100 | #284 | Tragic 49.5% |
| Crow | 0.0 /100 | #285 | Tragic 49.6% |
| Immigrants | Belize | 0.0 /100 | #286 | Tragic 49.6% |
| Sioux | 0.0 /100 | #287 | Tragic 49.7% |
| Yaqui | 0.0 /100 | #288 | Tragic 49.8% |
| Osage | 0.0 /100 | #289 | Tragic 49.8% |
| Puget Sound Salish | 0.0 /100 | #290 | Tragic 49.8% |
| Arapaho | 0.0 /100 | #291 | Tragic 49.8% |
| Shoshone | 0.0 /100 | #292 | Tragic 49.9% |