Immigrants from Sweden vs Guyanese Disability Age 35 to 64
COMPARE
Immigrants from Sweden
Guyanese
Disability Age 35 to 64
Disability Age 35 to 64 Comparison
Immigrants from Sweden
Guyanese
9.9%
DISABILITY AGE 35 TO 64
99.7/ 100
METRIC RATING
59th/ 347
METRIC RANK
11.0%
DISABILITY AGE 35 TO 64
75.1/ 100
METRIC RATING
157th/ 347
METRIC RANK
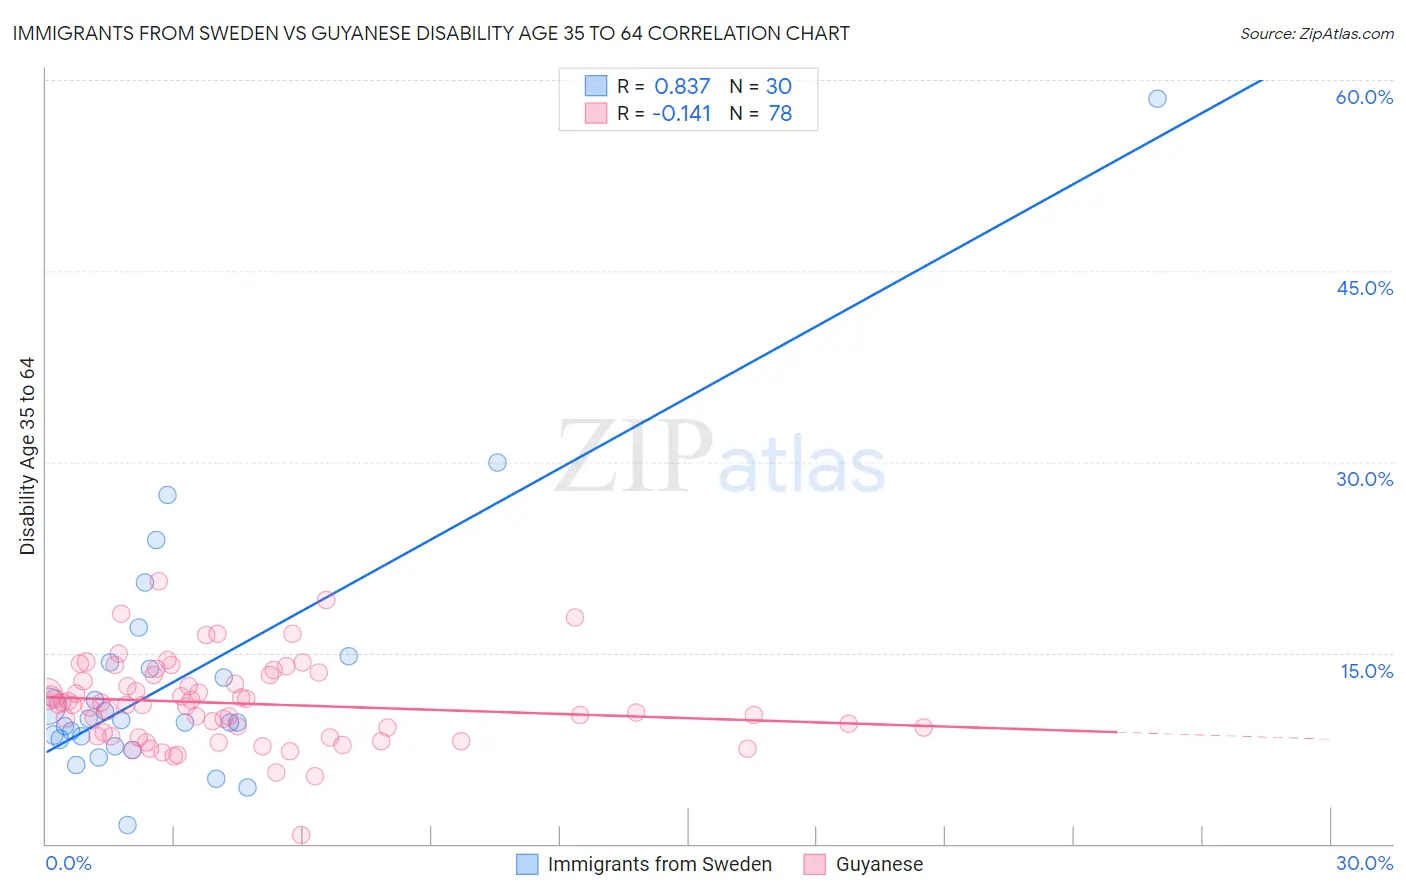
Immigrants from Sweden vs Guyanese Disability Age 35 to 64 Correlation Chart
The statistical analysis conducted on geographies consisting of 164,695,763 people shows a very strong positive correlation between the proportion of Immigrants from Sweden and percentage of population with a disability between the ages 34 and 64 in the United States with a correlation coefficient (R) of 0.837 and weighted average of 9.9%. Similarly, the statistical analysis conducted on geographies consisting of 176,764,315 people shows a poor negative correlation between the proportion of Guyanese and percentage of population with a disability between the ages 34 and 64 in the United States with a correlation coefficient (R) of -0.141 and weighted average of 11.0%, a difference of 11.1%.
Disability Age 35 to 64 Correlation Summary
| Measurement | Immigrants from Sweden | Guyanese |
| Minimum | 1.4% | 0.73% |
| Maximum | 58.5% | 20.7% |
| Range | 57.1% | 19.9% |
| Mean | 13.2% | 11.0% |
| Median | 9.7% | 10.9% |
| Interquartile 25% (IQ1) | 8.2% | 8.5% |
| Interquartile 75% (IQ3) | 14.2% | 13.3% |
| Interquartile Range (IQR) | 6.0% | 4.8% |
| Standard Deviation (Sample) | 10.7% | 3.3% |
| Standard Deviation (Population) | 10.6% | 3.3% |
Similar Demographics by Disability Age 35 to 64
Demographics Similar to Immigrants from Sweden by Disability Age 35 to 64
In terms of disability age 35 to 64, the demographic groups most similar to Immigrants from Sweden are Immigrants from South America (9.9%, a difference of 0.21%), Armenian (9.9%, a difference of 0.30%), Immigrants from Spain (10.0%, a difference of 0.33%), Colombian (9.9%, a difference of 0.40%), and South American (9.9%, a difference of 0.42%).
| Demographics | Rating | Rank | Disability Age 35 to 64 |
| Immigrants | Bulgaria | 99.8 /100 | #52 | Exceptional 9.8% |
| Taiwanese | 99.8 /100 | #53 | Exceptional 9.8% |
| Immigrants | Russia | 99.8 /100 | #54 | Exceptional 9.8% |
| Peruvians | 99.8 /100 | #55 | Exceptional 9.9% |
| South Americans | 99.8 /100 | #56 | Exceptional 9.9% |
| Colombians | 99.8 /100 | #57 | Exceptional 9.9% |
| Armenians | 99.8 /100 | #58 | Exceptional 9.9% |
| Immigrants | Sweden | 99.7 /100 | #59 | Exceptional 9.9% |
| Immigrants | South America | 99.7 /100 | #60 | Exceptional 9.9% |
| Immigrants | Spain | 99.7 /100 | #61 | Exceptional 10.0% |
| Eastern Europeans | 99.7 /100 | #62 | Exceptional 10.0% |
| Immigrants | Czechoslovakia | 99.7 /100 | #63 | Exceptional 10.0% |
| Immigrants | Romania | 99.7 /100 | #64 | Exceptional 10.0% |
| Immigrants | Poland | 99.6 /100 | #65 | Exceptional 10.0% |
| Cubans | 99.6 /100 | #66 | Exceptional 10.0% |
Demographics Similar to Guyanese by Disability Age 35 to 64
In terms of disability age 35 to 64, the demographic groups most similar to Guyanese are Immigrants from North America (11.0%, a difference of 0.010%), Immigrants from Sierra Leone (11.0%, a difference of 0.13%), Moroccan (11.0%, a difference of 0.15%), Serbian (11.0%, a difference of 0.16%), and Immigrants from Canada (11.0%, a difference of 0.19%).
| Demographics | Rating | Rank | Disability Age 35 to 64 |
| Syrians | 79.8 /100 | #150 | Good 11.0% |
| New Zealanders | 79.3 /100 | #151 | Good 11.0% |
| Ukrainians | 78.0 /100 | #152 | Good 11.0% |
| Immigrants | England | 77.4 /100 | #153 | Good 11.0% |
| Immigrants | Canada | 76.7 /100 | #154 | Good 11.0% |
| Moroccans | 76.4 /100 | #155 | Good 11.0% |
| Immigrants | Sierra Leone | 76.2 /100 | #156 | Good 11.0% |
| Guyanese | 75.1 /100 | #157 | Good 11.0% |
| Immigrants | North America | 74.9 /100 | #158 | Good 11.0% |
| Serbians | 73.6 /100 | #159 | Good 11.0% |
| Croatians | 73.1 /100 | #160 | Good 11.0% |
| Immigrants | Guyana | 70.1 /100 | #161 | Good 11.1% |
| Immigrants | Grenada | 68.4 /100 | #162 | Good 11.1% |
| Immigrants | St. Vincent and the Grenadines | 66.6 /100 | #163 | Good 11.1% |
| Pakistanis | 65.8 /100 | #164 | Good 11.1% |