Immigrants from Sri Lanka vs South African Disability Age 18 to 34
COMPARE
Immigrants from Sri Lanka
South African
Disability Age 18 to 34
Disability Age 18 to 34 Comparison
Immigrants from Sri Lanka
South Africans
6.0%
DISABILITY AGE 18 TO 34
99.6/ 100
METRIC RATING
60th/ 347
METRIC RANK
6.5%
DISABILITY AGE 18 TO 34
71.7/ 100
METRIC RATING
162nd/ 347
METRIC RANK
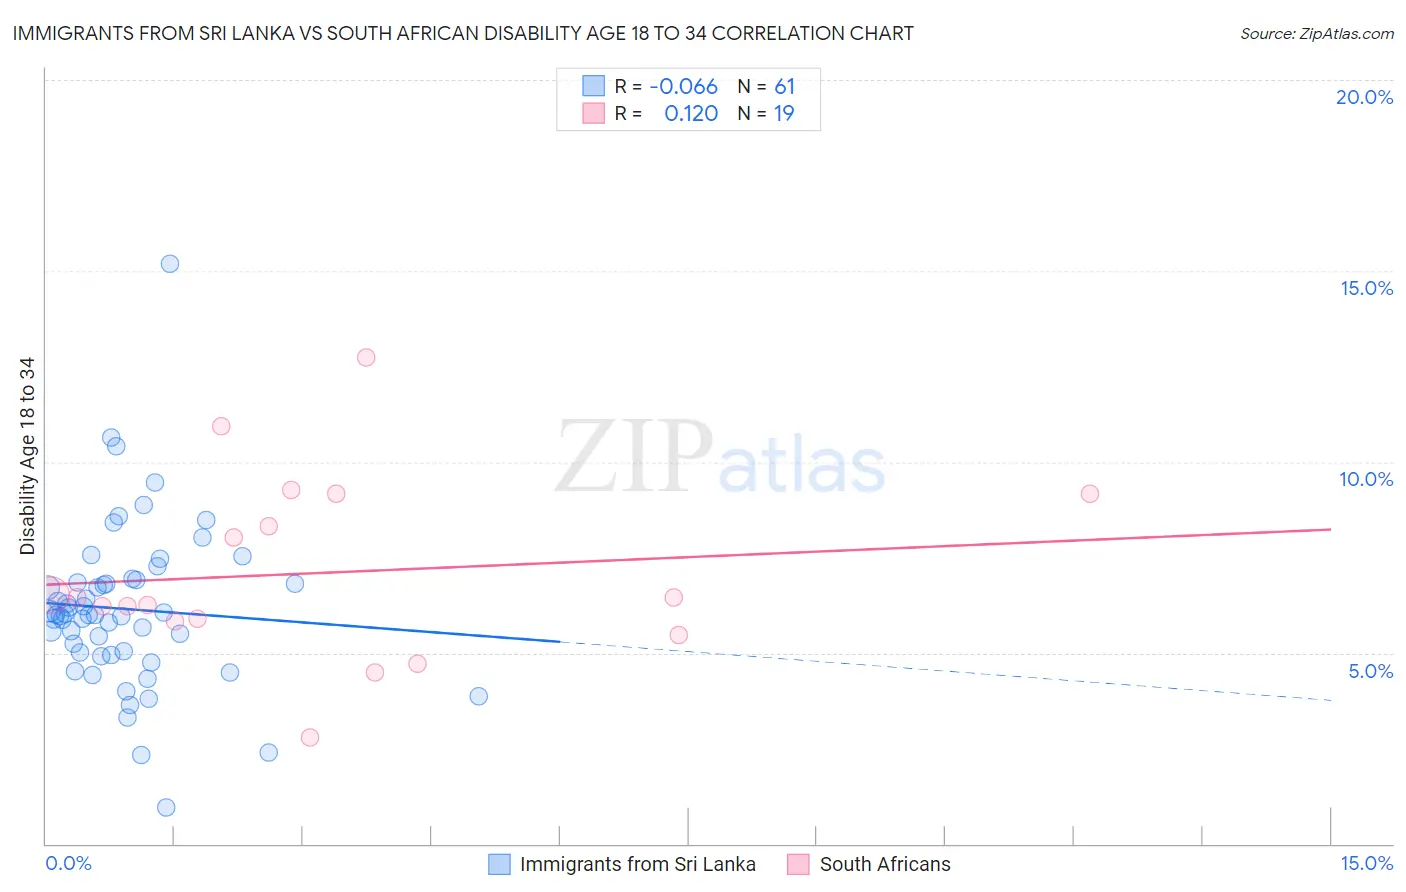
Immigrants from Sri Lanka vs South African Disability Age 18 to 34 Correlation Chart
The statistical analysis conducted on geographies consisting of 149,649,859 people shows a slight negative correlation between the proportion of Immigrants from Sri Lanka and percentage of population with a disability between the ages 18 and 35 in the United States with a correlation coefficient (R) of -0.066 and weighted average of 6.0%. Similarly, the statistical analysis conducted on geographies consisting of 182,336,959 people shows a poor positive correlation between the proportion of South Africans and percentage of population with a disability between the ages 18 and 35 in the United States with a correlation coefficient (R) of 0.120 and weighted average of 6.5%, a difference of 9.0%.
Disability Age 18 to 34 Correlation Summary
| Measurement | Immigrants from Sri Lanka | South African |
| Minimum | 0.96% | 2.8% |
| Maximum | 15.2% | 12.7% |
| Range | 14.2% | 9.9% |
| Mean | 6.1% | 7.1% |
| Median | 6.0% | 6.4% |
| Interquartile 25% (IQ1) | 5.0% | 5.8% |
| Interquartile 75% (IQ3) | 6.9% | 9.2% |
| Interquartile Range (IQR) | 1.9% | 3.3% |
| Standard Deviation (Sample) | 2.1% | 2.4% |
| Standard Deviation (Population) | 2.1% | 2.3% |
Similar Demographics by Disability Age 18 to 34
Demographics Similar to Immigrants from Sri Lanka by Disability Age 18 to 34
In terms of disability age 18 to 34, the demographic groups most similar to Immigrants from Sri Lanka are Immigrants from Caribbean (6.0%, a difference of 0.0%), Immigrants from Serbia (5.9%, a difference of 0.14%), Immigrants from Haiti (5.9%, a difference of 0.16%), British West Indian (6.0%, a difference of 0.26%), and Paraguayan (5.9%, a difference of 0.27%).
| Demographics | Rating | Rank | Disability Age 18 to 34 |
| Immigrants | Indonesia | 99.7 /100 | #53 | Exceptional 5.9% |
| Immigrants | Malaysia | 99.7 /100 | #54 | Exceptional 5.9% |
| Immigrants | Spain | 99.7 /100 | #55 | Exceptional 5.9% |
| Paraguayans | 99.7 /100 | #56 | Exceptional 5.9% |
| Immigrants | Haiti | 99.7 /100 | #57 | Exceptional 5.9% |
| Immigrants | Serbia | 99.7 /100 | #58 | Exceptional 5.9% |
| Immigrants | Caribbean | 99.6 /100 | #59 | Exceptional 6.0% |
| Immigrants | Sri Lanka | 99.6 /100 | #60 | Exceptional 6.0% |
| British West Indians | 99.6 /100 | #61 | Exceptional 6.0% |
| Peruvians | 99.6 /100 | #62 | Exceptional 6.0% |
| Salvadorans | 99.6 /100 | #63 | Exceptional 6.0% |
| Taiwanese | 99.6 /100 | #64 | Exceptional 6.0% |
| Trinidadians and Tobagonians | 99.5 /100 | #65 | Exceptional 6.0% |
| Burmese | 99.5 /100 | #66 | Exceptional 6.0% |
| Immigrants | North Macedonia | 99.5 /100 | #67 | Exceptional 6.0% |
Demographics Similar to South Africans by Disability Age 18 to 34
In terms of disability age 18 to 34, the demographic groups most similar to South Africans are Immigrants from Denmark (6.5%, a difference of 0.0%), Arab (6.5%, a difference of 0.060%), Immigrants from Southern Europe (6.5%, a difference of 0.080%), Immigrants from Nigeria (6.5%, a difference of 0.11%), and Dominican (6.5%, a difference of 0.17%).
| Demographics | Rating | Rank | Disability Age 18 to 34 |
| Inupiat | 76.7 /100 | #155 | Good 6.5% |
| Immigrants | Panama | 75.3 /100 | #156 | Good 6.5% |
| Immigrants | Sierra Leone | 75.0 /100 | #157 | Good 6.5% |
| Zimbabweans | 74.7 /100 | #158 | Good 6.5% |
| Dominicans | 73.6 /100 | #159 | Good 6.5% |
| Immigrants | Southern Europe | 72.5 /100 | #160 | Good 6.5% |
| Arabs | 72.3 /100 | #161 | Good 6.5% |
| South Africans | 71.7 /100 | #162 | Good 6.5% |
| Immigrants | Denmark | 71.7 /100 | #163 | Good 6.5% |
| Immigrants | Nigeria | 70.4 /100 | #164 | Good 6.5% |
| Immigrants | Hungary | 69.6 /100 | #165 | Good 6.5% |
| Eastern Europeans | 65.1 /100 | #166 | Good 6.5% |
| Immigrants | Northern Europe | 64.1 /100 | #167 | Good 6.5% |
| Immigrants | Moldova | 63.1 /100 | #168 | Good 6.5% |
| Russians | 60.2 /100 | #169 | Good 6.5% |