Immigrants from Austria vs South African Disability Age 18 to 34
COMPARE
Immigrants from Austria
South African
Disability Age 18 to 34
Disability Age 18 to 34 Comparison
Immigrants from Austria
South Africans
6.6%
DISABILITY AGE 18 TO 34
39.6/ 100
METRIC RATING
180th/ 347
METRIC RANK
6.5%
DISABILITY AGE 18 TO 34
71.7/ 100
METRIC RATING
162nd/ 347
METRIC RANK
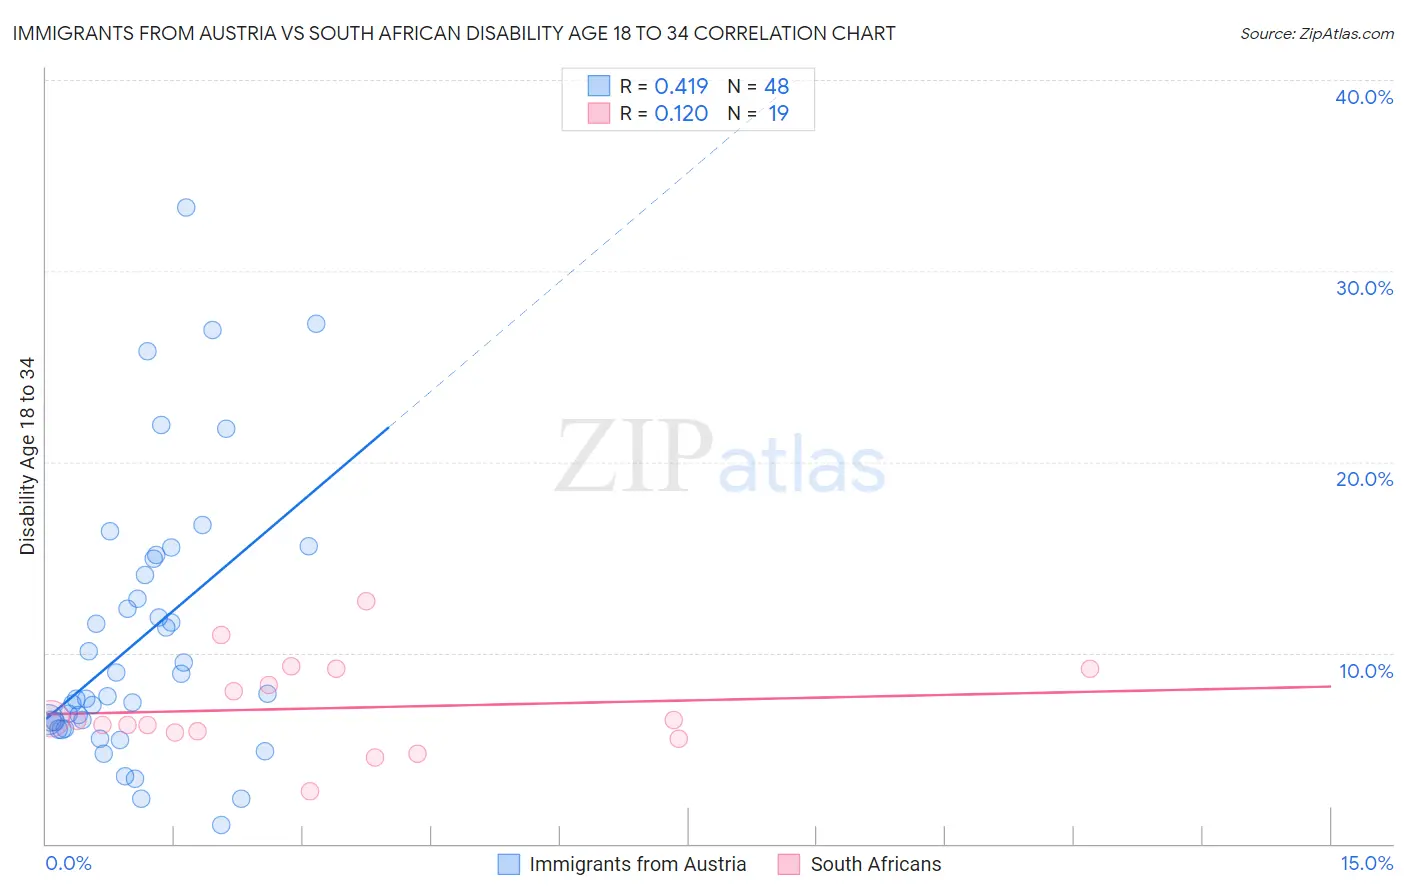
Immigrants from Austria vs South African Disability Age 18 to 34 Correlation Chart
The statistical analysis conducted on geographies consisting of 167,737,581 people shows a moderate positive correlation between the proportion of Immigrants from Austria and percentage of population with a disability between the ages 18 and 35 in the United States with a correlation coefficient (R) of 0.419 and weighted average of 6.6%. Similarly, the statistical analysis conducted on geographies consisting of 182,336,959 people shows a poor positive correlation between the proportion of South Africans and percentage of population with a disability between the ages 18 and 35 in the United States with a correlation coefficient (R) of 0.120 and weighted average of 6.5%, a difference of 2.4%.
Disability Age 18 to 34 Correlation Summary
| Measurement | Immigrants from Austria | South African |
| Minimum | 0.96% | 2.8% |
| Maximum | 33.3% | 12.7% |
| Range | 32.4% | 9.9% |
| Mean | 10.8% | 7.1% |
| Median | 7.8% | 6.4% |
| Interquartile 25% (IQ1) | 6.2% | 5.8% |
| Interquartile 75% (IQ3) | 14.5% | 9.2% |
| Interquartile Range (IQR) | 8.3% | 3.3% |
| Standard Deviation (Sample) | 7.2% | 2.4% |
| Standard Deviation (Population) | 7.1% | 2.3% |
Demographics Similar to Immigrants from Austria and South Africans by Disability Age 18 to 34
In terms of disability age 18 to 34, the demographic groups most similar to Immigrants from Austria are Romanian (6.6%, a difference of 0.010%), Immigrants from Ghana (6.6%, a difference of 0.18%), Nigerian (6.6%, a difference of 0.29%), Syrian (6.6%, a difference of 0.34%), and Immigrants from Africa (6.6%, a difference of 0.45%). Similarly, the demographic groups most similar to South Africans are Immigrants from Denmark (6.5%, a difference of 0.0%), Arab (6.5%, a difference of 0.060%), Immigrants from Nigeria (6.5%, a difference of 0.11%), Immigrants from Hungary (6.5%, a difference of 0.17%), and Eastern European (6.5%, a difference of 0.53%).
| Demographics | Rating | Rank | Disability Age 18 to 34 |
| Arabs | 72.3 /100 | #161 | Good 6.5% |
| South Africans | 71.7 /100 | #162 | Good 6.5% |
| Immigrants | Denmark | 71.7 /100 | #163 | Good 6.5% |
| Immigrants | Nigeria | 70.4 /100 | #164 | Good 6.5% |
| Immigrants | Hungary | 69.6 /100 | #165 | Good 6.5% |
| Eastern Europeans | 65.1 /100 | #166 | Good 6.5% |
| Immigrants | Northern Europe | 64.1 /100 | #167 | Good 6.5% |
| Immigrants | Moldova | 63.1 /100 | #168 | Good 6.5% |
| Russians | 60.2 /100 | #169 | Good 6.5% |
| Immigrants | Bahamas | 57.9 /100 | #170 | Average 6.6% |
| Bahamians | 55.5 /100 | #171 | Average 6.6% |
| Ghanaians | 54.7 /100 | #172 | Average 6.6% |
| Immigrants | Mexico | 54.1 /100 | #173 | Average 6.6% |
| Native Hawaiians | 50.0 /100 | #174 | Average 6.6% |
| Immigrants | Cambodia | 46.5 /100 | #175 | Average 6.6% |
| Immigrants | Africa | 45.9 /100 | #176 | Average 6.6% |
| Syrians | 44.3 /100 | #177 | Average 6.6% |
| Nigerians | 43.7 /100 | #178 | Average 6.6% |
| Immigrants | Ghana | 42.1 /100 | #179 | Average 6.6% |
| Immigrants | Austria | 39.6 /100 | #180 | Fair 6.6% |
| Romanians | 39.5 /100 | #181 | Fair 6.6% |