Immigrants from Lithuania vs Immigrants from Malaysia Female Disability
COMPARE
Immigrants from Lithuania
Immigrants from Malaysia
Female Disability
Female Disability Comparison
Immigrants from Lithuania
Immigrants from Malaysia
11.2%
FEMALE DISABILITY
100.0/ 100
METRIC RATING
39th/ 347
METRIC RANK
11.1%
FEMALE DISABILITY
100.0/ 100
METRIC RATING
29th/ 347
METRIC RANK
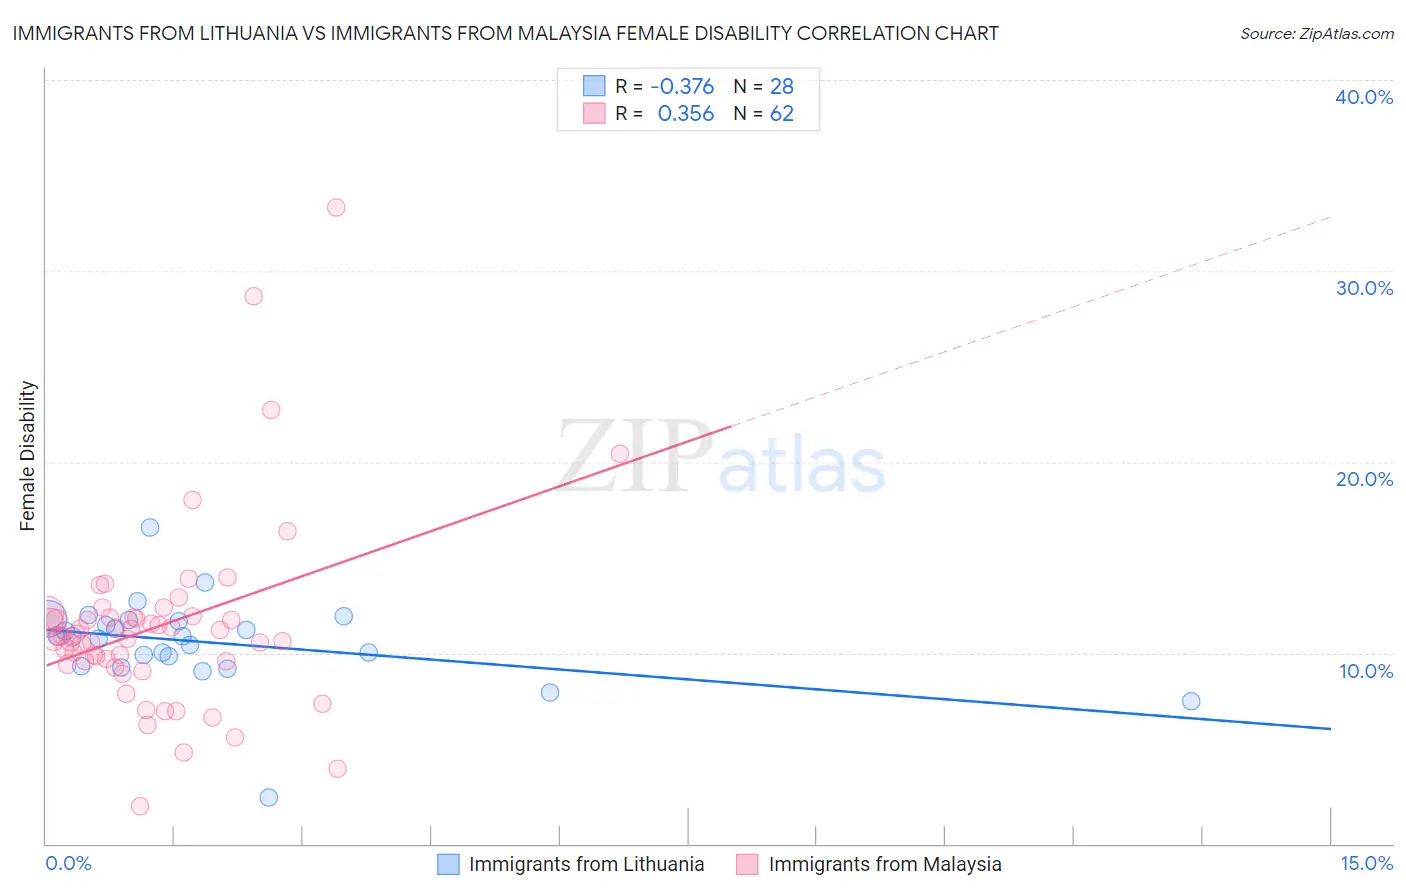
Immigrants from Lithuania vs Immigrants from Malaysia Female Disability Correlation Chart
The statistical analysis conducted on geographies consisting of 117,714,022 people shows a mild negative correlation between the proportion of Immigrants from Lithuania and percentage of females with a disability in the United States with a correlation coefficient (R) of -0.376 and weighted average of 11.2%. Similarly, the statistical analysis conducted on geographies consisting of 197,971,207 people shows a mild positive correlation between the proportion of Immigrants from Malaysia and percentage of females with a disability in the United States with a correlation coefficient (R) of 0.356 and weighted average of 11.1%, a difference of 1.1%.
Female Disability Correlation Summary
| Measurement | Immigrants from Lithuania | Immigrants from Malaysia |
| Minimum | 2.4% | 1.9% |
| Maximum | 16.5% | 33.3% |
| Range | 14.1% | 31.4% |
| Mean | 10.5% | 11.4% |
| Median | 10.8% | 10.9% |
| Interquartile 25% (IQ1) | 9.6% | 9.5% |
| Interquartile 75% (IQ3) | 11.7% | 11.8% |
| Interquartile Range (IQR) | 2.1% | 2.3% |
| Standard Deviation (Sample) | 2.4% | 4.9% |
| Standard Deviation (Population) | 2.3% | 4.9% |
Demographics Similar to Immigrants from Lithuania and Immigrants from Malaysia by Female Disability
In terms of female disability, the demographic groups most similar to Immigrants from Lithuania are Mongolian (11.2%, a difference of 0.030%), Paraguayan (11.2%, a difference of 0.050%), Israeli (11.2%, a difference of 0.15%), Afghan (11.2%, a difference of 0.17%), and Immigrants from Ethiopia (11.2%, a difference of 0.21%). Similarly, the demographic groups most similar to Immigrants from Malaysia are Turkish (11.1%, a difference of 0.0%), Egyptian (11.1%, a difference of 0.060%), Immigrants from Kuwait (11.1%, a difference of 0.10%), Immigrants from Australia (11.1%, a difference of 0.27%), and Immigrants from Turkey (11.1%, a difference of 0.34%).
| Demographics | Rating | Rank | Female Disability |
| Immigrants | Argentina | 100.0 /100 | #24 | Exceptional 11.0% |
| Immigrants | Asia | 100.0 /100 | #25 | Exceptional 11.0% |
| Argentineans | 100.0 /100 | #26 | Exceptional 11.0% |
| Immigrants | Turkey | 100.0 /100 | #27 | Exceptional 11.1% |
| Egyptians | 100.0 /100 | #28 | Exceptional 11.1% |
| Immigrants | Malaysia | 100.0 /100 | #29 | Exceptional 11.1% |
| Turks | 100.0 /100 | #30 | Exceptional 11.1% |
| Immigrants | Kuwait | 100.0 /100 | #31 | Exceptional 11.1% |
| Immigrants | Australia | 100.0 /100 | #32 | Exceptional 11.1% |
| Immigrants | Egypt | 100.0 /100 | #33 | Exceptional 11.1% |
| Immigrants | Indonesia | 100.0 /100 | #34 | Exceptional 11.2% |
| Immigrants | Japan | 100.0 /100 | #35 | Exceptional 11.2% |
| Cypriots | 100.0 /100 | #36 | Exceptional 11.2% |
| Ethiopians | 100.0 /100 | #37 | Exceptional 11.2% |
| Immigrants | Ethiopia | 100.0 /100 | #38 | Exceptional 11.2% |
| Immigrants | Lithuania | 100.0 /100 | #39 | Exceptional 11.2% |
| Mongolians | 100.0 /100 | #40 | Exceptional 11.2% |
| Paraguayans | 100.0 /100 | #41 | Exceptional 11.2% |
| Israelis | 100.0 /100 | #42 | Exceptional 11.2% |
| Afghans | 100.0 /100 | #43 | Exceptional 11.2% |
| Cambodians | 100.0 /100 | #44 | Exceptional 11.3% |