Immigrants from Somalia vs Spanish American Indian Disability Age 18 to 34
COMPARE
Immigrants from Somalia
Spanish American Indian
Disability Age 18 to 34
Disability Age 18 to 34 Comparison
Immigrants from Somalia
Spanish American Indians
7.4%
DISABILITY AGE 18 TO 34
0.1/ 100
METRIC RATING
275th/ 347
METRIC RANK
6.4%
DISABILITY AGE 18 TO 34
87.7/ 100
METRIC RATING
138th/ 347
METRIC RANK
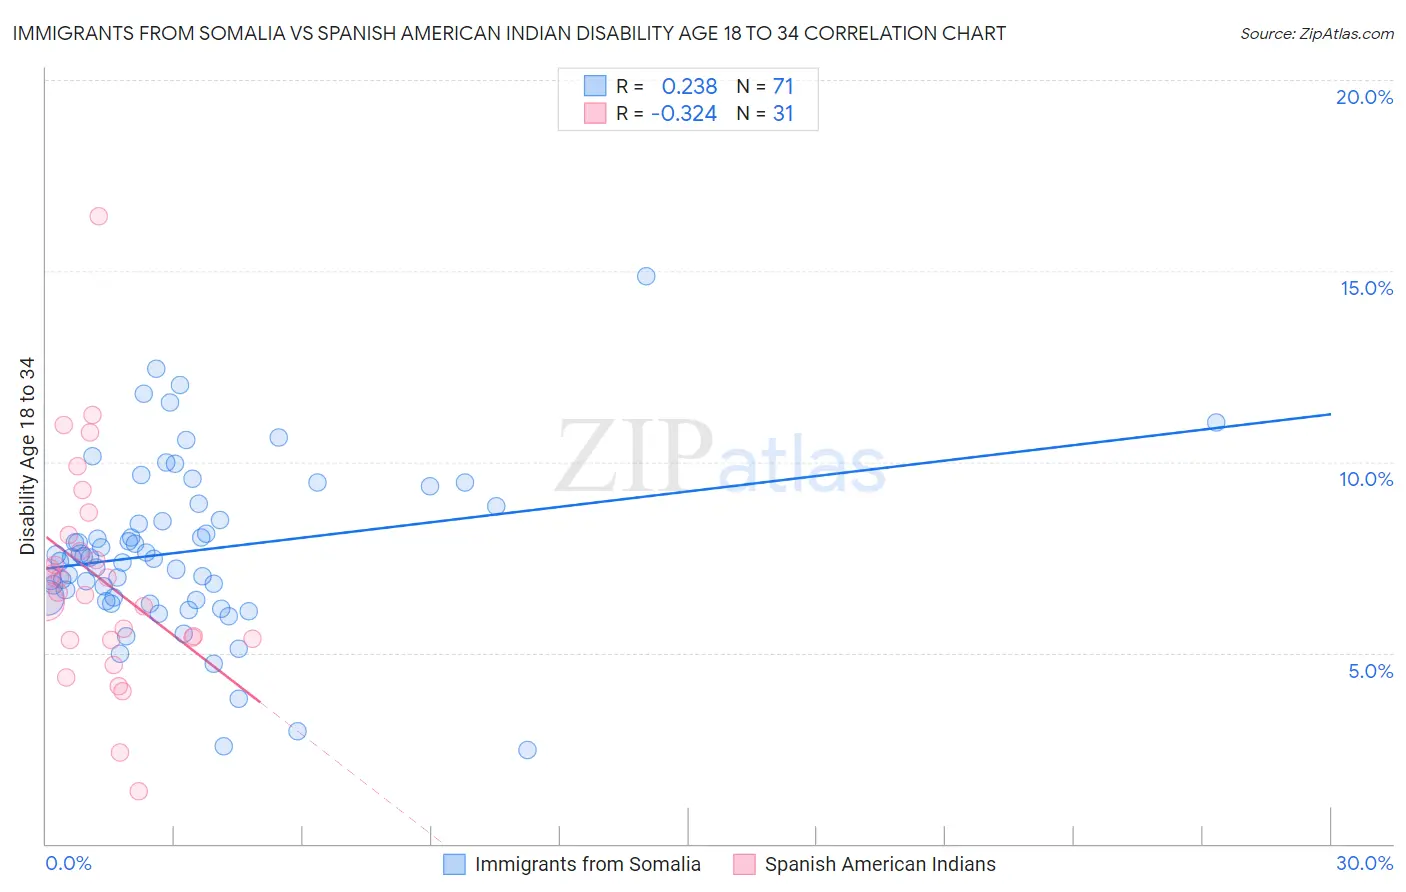
Immigrants from Somalia vs Spanish American Indian Disability Age 18 to 34 Correlation Chart
The statistical analysis conducted on geographies consisting of 92,071,714 people shows a weak positive correlation between the proportion of Immigrants from Somalia and percentage of population with a disability between the ages 18 and 35 in the United States with a correlation coefficient (R) of 0.238 and weighted average of 7.4%. Similarly, the statistical analysis conducted on geographies consisting of 73,116,969 people shows a mild negative correlation between the proportion of Spanish American Indians and percentage of population with a disability between the ages 18 and 35 in the United States with a correlation coefficient (R) of -0.324 and weighted average of 6.4%, a difference of 16.1%.
Disability Age 18 to 34 Correlation Summary
| Measurement | Immigrants from Somalia | Spanish American Indian |
| Minimum | 2.5% | 1.4% |
| Maximum | 14.9% | 16.4% |
| Range | 12.4% | 15.1% |
| Mean | 7.7% | 6.9% |
| Median | 7.5% | 6.6% |
| Interquartile 25% (IQ1) | 6.4% | 5.3% |
| Interquartile 75% (IQ3) | 8.8% | 8.1% |
| Interquartile Range (IQR) | 2.5% | 2.7% |
| Standard Deviation (Sample) | 2.2% | 2.9% |
| Standard Deviation (Population) | 2.2% | 2.9% |
Similar Demographics by Disability Age 18 to 34
Demographics Similar to Immigrants from Somalia by Disability Age 18 to 34
In terms of disability age 18 to 34, the demographic groups most similar to Immigrants from Somalia are European (7.4%, a difference of 0.050%), African (7.4%, a difference of 0.070%), Slavic (7.4%, a difference of 0.080%), Tsimshian (7.4%, a difference of 0.13%), and Swiss (7.4%, a difference of 0.22%).
| Demographics | Rating | Rank | Disability Age 18 to 34 |
| Portuguese | 0.1 /100 | #268 | Tragic 7.4% |
| Basques | 0.1 /100 | #269 | Tragic 7.4% |
| Belgians | 0.1 /100 | #270 | Tragic 7.4% |
| Swiss | 0.1 /100 | #271 | Tragic 7.4% |
| Tsimshian | 0.1 /100 | #272 | Tragic 7.4% |
| Slavs | 0.1 /100 | #273 | Tragic 7.4% |
| Africans | 0.1 /100 | #274 | Tragic 7.4% |
| Immigrants | Somalia | 0.1 /100 | #275 | Tragic 7.4% |
| Europeans | 0.1 /100 | #276 | Tragic 7.4% |
| Immigrants | Portugal | 0.1 /100 | #277 | Tragic 7.4% |
| Lumbee | 0.1 /100 | #278 | Tragic 7.4% |
| Czechoslovakians | 0.1 /100 | #279 | Tragic 7.4% |
| Yaqui | 0.1 /100 | #280 | Tragic 7.4% |
| Paiute | 0.0 /100 | #281 | Tragic 7.5% |
| Spanish | 0.0 /100 | #282 | Tragic 7.5% |
Demographics Similar to Spanish American Indians by Disability Age 18 to 34
In terms of disability age 18 to 34, the demographic groups most similar to Spanish American Indians are Immigrants from Honduras (6.4%, a difference of 0.0%), Immigrants from Belize (6.4%, a difference of 0.050%), Immigrants from Fiji (6.4%, a difference of 0.070%), Immigrants from Sweden (6.4%, a difference of 0.13%), and Palestinian (6.4%, a difference of 0.14%).
| Demographics | Rating | Rank | Disability Age 18 to 34 |
| Immigrants | Saudi Arabia | 90.4 /100 | #131 | Exceptional 6.3% |
| Guatemalans | 89.6 /100 | #132 | Excellent 6.4% |
| Brazilians | 89.0 /100 | #133 | Excellent 6.4% |
| Immigrants | Europe | 88.8 /100 | #134 | Excellent 6.4% |
| Palestinians | 88.5 /100 | #135 | Excellent 6.4% |
| Immigrants | Sweden | 88.5 /100 | #136 | Excellent 6.4% |
| Immigrants | Honduras | 87.7 /100 | #137 | Excellent 6.4% |
| Spanish American Indians | 87.7 /100 | #138 | Excellent 6.4% |
| Immigrants | Belize | 87.4 /100 | #139 | Excellent 6.4% |
| Immigrants | Fiji | 87.3 /100 | #140 | Excellent 6.4% |
| Jamaicans | 86.8 /100 | #141 | Excellent 6.4% |
| South American Indians | 86.5 /100 | #142 | Excellent 6.4% |
| Immigrants | Latvia | 86.4 /100 | #143 | Excellent 6.4% |
| Albanians | 85.3 /100 | #144 | Excellent 6.4% |
| Moroccans | 85.2 /100 | #145 | Excellent 6.4% |