Immigrants from Greece vs Immigrants from Bosnia and Herzegovina Hearing Disability
COMPARE
Immigrants from Greece
Immigrants from Bosnia and Herzegovina
Hearing Disability
Hearing Disability Comparison
Immigrants from Greece
Immigrants from Bosnia and Herzegovina
3.0%
HEARING DISABILITY
57.9/ 100
METRIC RATING
168th/ 347
METRIC RANK
3.1%
HEARING DISABILITY
20.6/ 100
METRIC RATING
197th/ 347
METRIC RANK
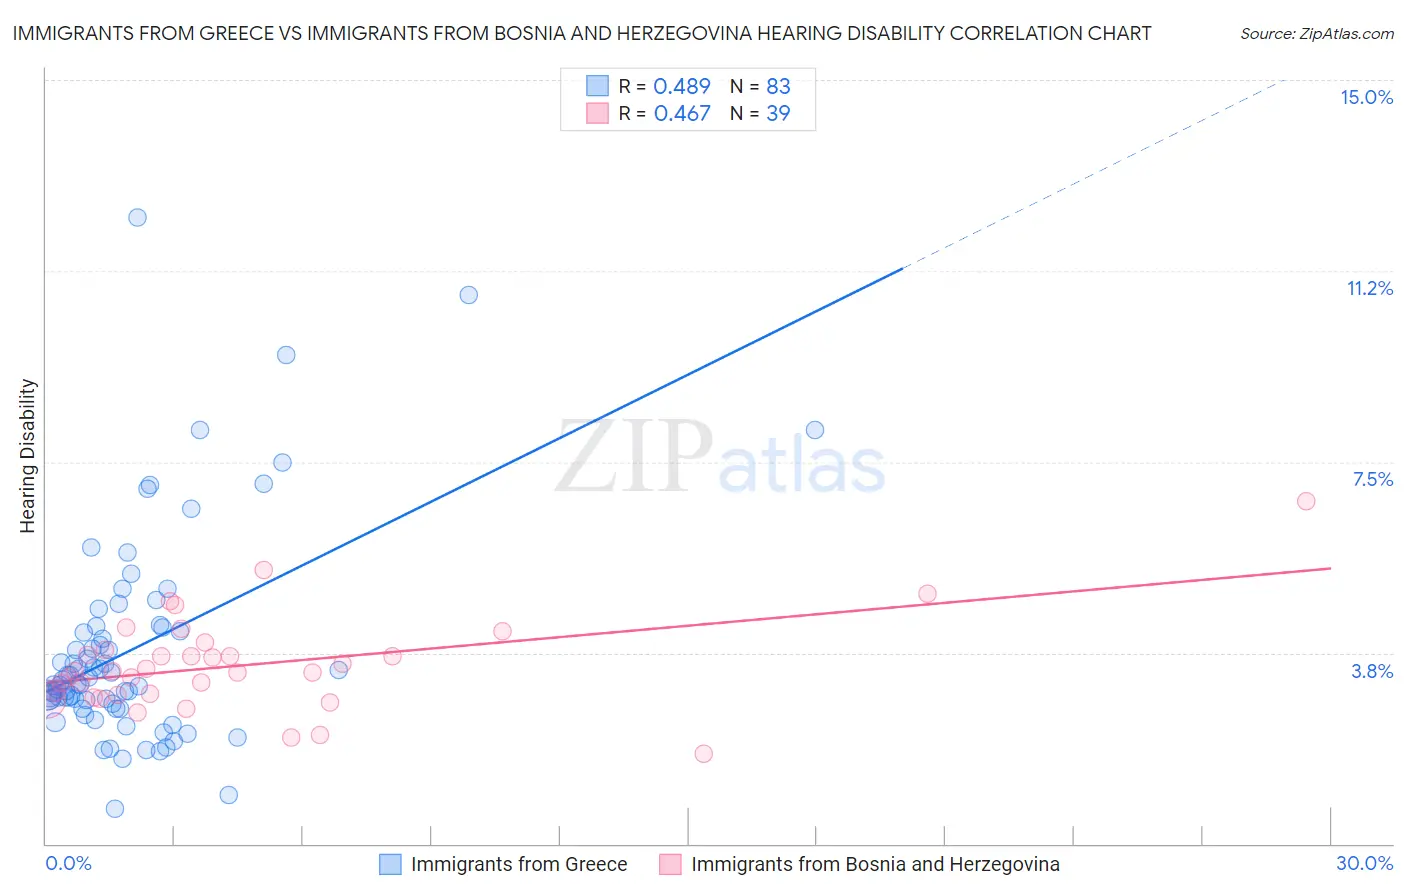
Immigrants from Greece vs Immigrants from Bosnia and Herzegovina Hearing Disability Correlation Chart
The statistical analysis conducted on geographies consisting of 216,842,518 people shows a moderate positive correlation between the proportion of Immigrants from Greece and percentage of population with hearing disability in the United States with a correlation coefficient (R) of 0.489 and weighted average of 3.0%. Similarly, the statistical analysis conducted on geographies consisting of 156,806,751 people shows a moderate positive correlation between the proportion of Immigrants from Bosnia and Herzegovina and percentage of population with hearing disability in the United States with a correlation coefficient (R) of 0.467 and weighted average of 3.1%, a difference of 4.0%.
Hearing Disability Correlation Summary
| Measurement | Immigrants from Greece | Immigrants from Bosnia and Herzegovina |
| Minimum | 0.70% | 1.8% |
| Maximum | 12.3% | 6.7% |
| Range | 11.6% | 5.0% |
| Mean | 3.8% | 3.5% |
| Median | 3.2% | 3.4% |
| Interquartile 25% (IQ1) | 2.8% | 2.9% |
| Interquartile 75% (IQ3) | 4.3% | 3.8% |
| Interquartile Range (IQR) | 1.5% | 0.89% |
| Standard Deviation (Sample) | 2.1% | 0.93% |
| Standard Deviation (Population) | 2.0% | 0.91% |
Similar Demographics by Hearing Disability
Demographics Similar to Immigrants from Greece by Hearing Disability
In terms of hearing disability, the demographic groups most similar to Immigrants from Greece are Immigrants from Eastern Europe (3.0%, a difference of 0.020%), Arab (3.0%, a difference of 0.030%), Immigrants from Cabo Verde (3.0%, a difference of 0.10%), Immigrants from Ukraine (3.0%, a difference of 0.12%), and Armenian (3.0%, a difference of 0.18%).
| Demographics | Rating | Rank | Hearing Disability |
| Albanians | 66.6 /100 | #161 | Good 2.9% |
| Immigrants | Japan | 66.3 /100 | #162 | Good 2.9% |
| Immigrants | Central America | 64.9 /100 | #163 | Good 3.0% |
| Immigrants | Cambodia | 64.8 /100 | #164 | Good 3.0% |
| Immigrants | Zimbabwe | 64.2 /100 | #165 | Good 3.0% |
| Immigrants | South Eastern Asia | 62.9 /100 | #166 | Good 3.0% |
| Immigrants | Eastern Europe | 58.1 /100 | #167 | Average 3.0% |
| Immigrants | Greece | 57.9 /100 | #168 | Average 3.0% |
| Arabs | 57.6 /100 | #169 | Average 3.0% |
| Immigrants | Cabo Verde | 56.9 /100 | #170 | Average 3.0% |
| Immigrants | Ukraine | 56.6 /100 | #171 | Average 3.0% |
| Armenians | 56.0 /100 | #172 | Average 3.0% |
| Immigrants | Serbia | 51.1 /100 | #173 | Average 3.0% |
| Indonesians | 50.0 /100 | #174 | Average 3.0% |
| Immigrants | Romania | 48.4 /100 | #175 | Average 3.0% |
Demographics Similar to Immigrants from Bosnia and Herzegovina by Hearing Disability
In terms of hearing disability, the demographic groups most similar to Immigrants from Bosnia and Herzegovina are Immigrants from Croatia (3.1%, a difference of 0.020%), Syrian (3.1%, a difference of 0.20%), Immigrants from North Macedonia (3.1%, a difference of 0.21%), Iraqi (3.1%, a difference of 0.24%), and Immigrants from Europe (3.1%, a difference of 0.30%).
| Demographics | Rating | Rank | Hearing Disability |
| Immigrants | South Africa | 31.1 /100 | #190 | Fair 3.1% |
| Immigrants | Switzerland | 28.8 /100 | #191 | Fair 3.1% |
| Koreans | 27.6 /100 | #192 | Fair 3.1% |
| Macedonians | 27.0 /100 | #193 | Fair 3.1% |
| South Africans | 24.5 /100 | #194 | Fair 3.1% |
| Spanish American Indians | 24.1 /100 | #195 | Fair 3.1% |
| Immigrants | Europe | 22.9 /100 | #196 | Fair 3.1% |
| Immigrants | Bosnia and Herzegovina | 20.6 /100 | #197 | Fair 3.1% |
| Immigrants | Croatia | 20.5 /100 | #198 | Fair 3.1% |
| Syrians | 19.2 /100 | #199 | Poor 3.1% |
| Immigrants | North Macedonia | 19.1 /100 | #200 | Poor 3.1% |
| Iraqis | 19.0 /100 | #201 | Poor 3.1% |
| Immigrants | Thailand | 16.4 /100 | #202 | Poor 3.1% |
| Immigrants | Denmark | 16.2 /100 | #203 | Poor 3.1% |
| Immigrants | Czechoslovakia | 15.9 /100 | #204 | Poor 3.1% |