Immigrants from Romania vs Tongan Cognitive Disability
COMPARE
Immigrants from Romania
Tongan
Cognitive Disability
Cognitive Disability Comparison
Immigrants from Romania
Tongans
16.4%
COGNITIVE DISABILITY
99.9/ 100
METRIC RATING
31st/ 347
METRIC RANK
17.8%
COGNITIVE DISABILITY
2.1/ 100
METRIC RATING
232nd/ 347
METRIC RANK
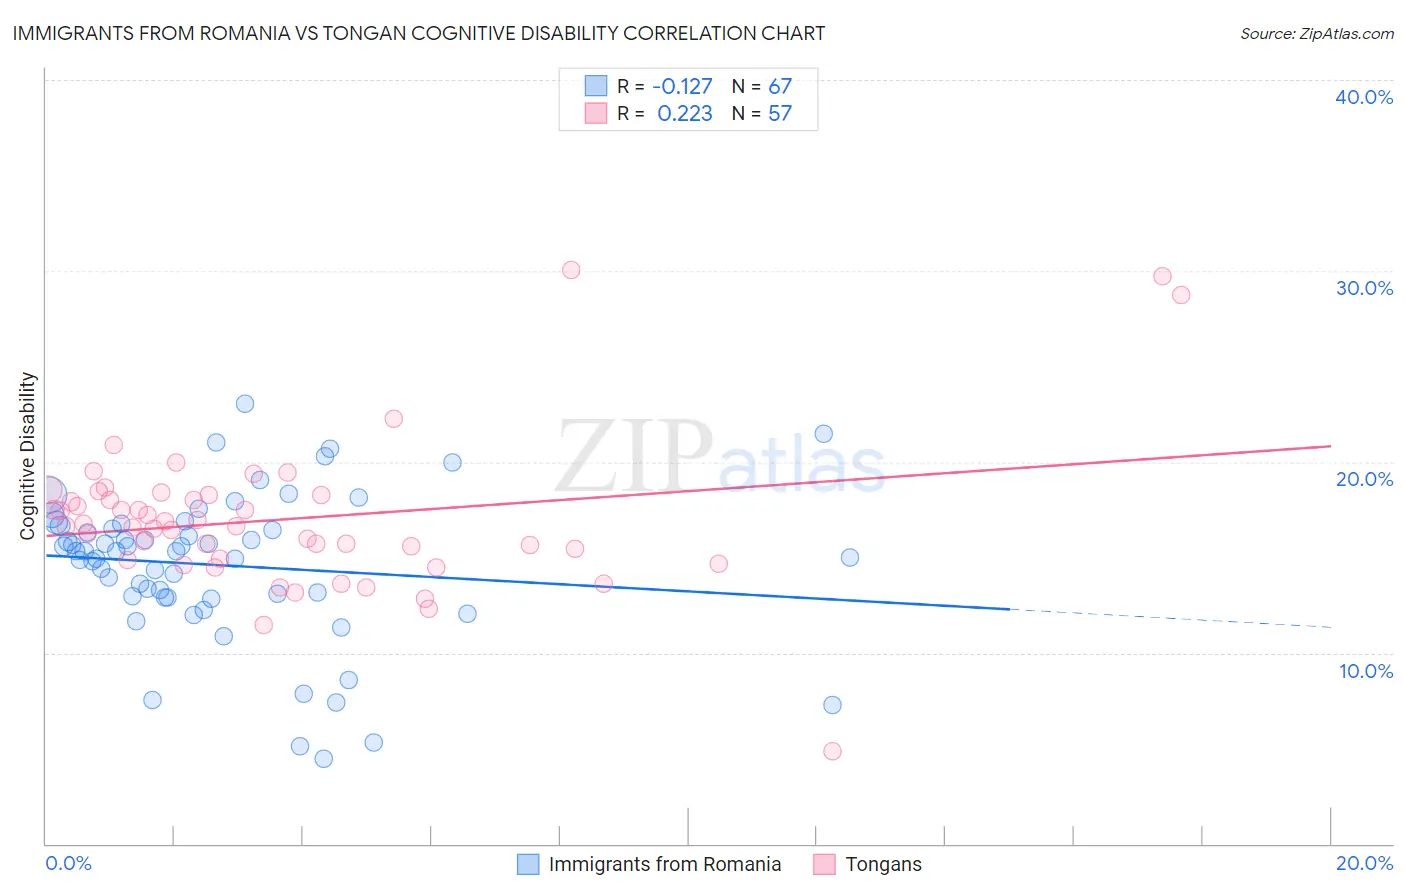
Immigrants from Romania vs Tongan Cognitive Disability Correlation Chart
The statistical analysis conducted on geographies consisting of 256,996,926 people shows a poor negative correlation between the proportion of Immigrants from Romania and percentage of population with cognitive disability in the United States with a correlation coefficient (R) of -0.127 and weighted average of 16.4%. Similarly, the statistical analysis conducted on geographies consisting of 102,895,026 people shows a weak positive correlation between the proportion of Tongans and percentage of population with cognitive disability in the United States with a correlation coefficient (R) of 0.223 and weighted average of 17.8%, a difference of 8.3%.
Cognitive Disability Correlation Summary
| Measurement | Immigrants from Romania | Tongan |
| Minimum | 4.5% | 4.8% |
| Maximum | 23.1% | 30.0% |
| Range | 18.6% | 25.2% |
| Mean | 14.6% | 17.0% |
| Median | 15.3% | 16.6% |
| Interquartile 25% (IQ1) | 12.9% | 14.9% |
| Interquartile 75% (IQ3) | 16.7% | 18.3% |
| Interquartile Range (IQR) | 3.8% | 3.4% |
| Standard Deviation (Sample) | 3.9% | 4.0% |
| Standard Deviation (Population) | 3.8% | 3.9% |
Similar Demographics by Cognitive Disability
Demographics Similar to Immigrants from Romania by Cognitive Disability
In terms of cognitive disability, the demographic groups most similar to Immigrants from Romania are Filipino (16.4%, a difference of 0.020%), Czech (16.4%, a difference of 0.020%), Immigrants from Pakistan (16.4%, a difference of 0.050%), Polish (16.4%, a difference of 0.050%), and Immigrants from Israel (16.4%, a difference of 0.050%).
| Demographics | Rating | Rank | Cognitive Disability |
| Immigrants | Argentina | 99.9 /100 | #24 | Exceptional 16.4% |
| Luxembourgers | 99.9 /100 | #25 | Exceptional 16.4% |
| Immigrants | Croatia | 99.9 /100 | #26 | Exceptional 16.4% |
| Immigrants | Pakistan | 99.9 /100 | #27 | Exceptional 16.4% |
| Poles | 99.9 /100 | #28 | Exceptional 16.4% |
| Filipinos | 99.9 /100 | #29 | Exceptional 16.4% |
| Czechs | 99.9 /100 | #30 | Exceptional 16.4% |
| Immigrants | Romania | 99.9 /100 | #31 | Exceptional 16.4% |
| Immigrants | Israel | 99.9 /100 | #32 | Exceptional 16.4% |
| Italians | 99.9 /100 | #33 | Exceptional 16.4% |
| Russians | 99.9 /100 | #34 | Exceptional 16.4% |
| Slovaks | 99.9 /100 | #35 | Exceptional 16.4% |
| Greeks | 99.9 /100 | #36 | Exceptional 16.4% |
| Slovenes | 99.9 /100 | #37 | Exceptional 16.5% |
| Immigrants | Eastern Europe | 99.9 /100 | #38 | Exceptional 16.5% |
Demographics Similar to Tongans by Cognitive Disability
In terms of cognitive disability, the demographic groups most similar to Tongans are Guatemalan (17.8%, a difference of 0.0%), Panamanian (17.8%, a difference of 0.0%), Osage (17.8%, a difference of 0.020%), Spanish American Indian (17.8%, a difference of 0.020%), and Mongolian (17.7%, a difference of 0.030%).
| Demographics | Rating | Rank | Cognitive Disability |
| Vietnamese | 3.4 /100 | #225 | Tragic 17.7% |
| Marshallese | 2.7 /100 | #226 | Tragic 17.7% |
| Immigrants | St. Vincent and the Grenadines | 2.6 /100 | #227 | Tragic 17.7% |
| Immigrants | Central America | 2.3 /100 | #228 | Tragic 17.7% |
| Immigrants | Guatemala | 2.2 /100 | #229 | Tragic 17.7% |
| Mongolians | 2.2 /100 | #230 | Tragic 17.7% |
| Guatemalans | 2.1 /100 | #231 | Tragic 17.8% |
| Tongans | 2.1 /100 | #232 | Tragic 17.8% |
| Panamanians | 2.1 /100 | #233 | Tragic 17.8% |
| Osage | 2.0 /100 | #234 | Tragic 17.8% |
| Spanish American Indians | 2.0 /100 | #235 | Tragic 17.8% |
| Immigrants | Iraq | 1.8 /100 | #236 | Tragic 17.8% |
| Immigrants | Mexico | 1.8 /100 | #237 | Tragic 17.8% |
| Cheyenne | 1.7 /100 | #238 | Tragic 17.8% |
| Cajuns | 1.4 /100 | #239 | Tragic 17.8% |