Immigrants from Romania vs Immigrants from Hungary Self-Care Disability
COMPARE
Immigrants from Romania
Immigrants from Hungary
Self-Care Disability
Self-Care Disability Comparison
Immigrants from Romania
Immigrants from Hungary
2.4%
SELF-CARE DISABILITY
89.3/ 100
METRIC RATING
129th/ 347
METRIC RANK
2.4%
SELF-CARE DISABILITY
89.6/ 100
METRIC RATING
128th/ 347
METRIC RANK
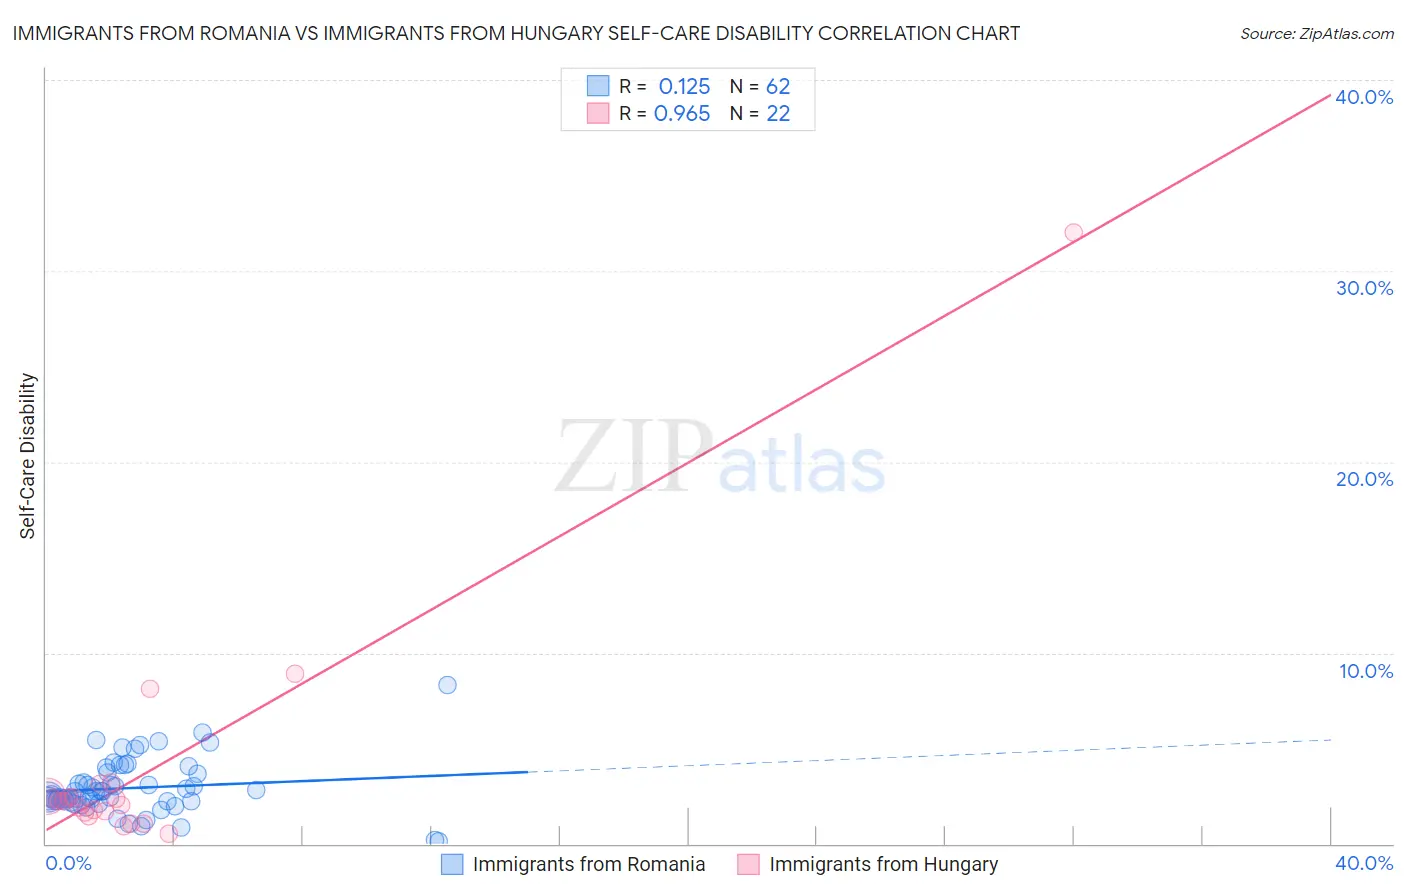
Immigrants from Romania vs Immigrants from Hungary Self-Care Disability Correlation Chart
The statistical analysis conducted on geographies consisting of 256,851,853 people shows a poor positive correlation between the proportion of Immigrants from Romania and percentage of population with self-care disability in the United States with a correlation coefficient (R) of 0.125 and weighted average of 2.4%. Similarly, the statistical analysis conducted on geographies consisting of 195,644,142 people shows a perfect positive correlation between the proportion of Immigrants from Hungary and percentage of population with self-care disability in the United States with a correlation coefficient (R) of 0.965 and weighted average of 2.4%, a difference of 0.050%.
Self-Care Disability Correlation Summary
| Measurement | Immigrants from Romania | Immigrants from Hungary |
| Minimum | 0.12% | 0.51% |
| Maximum | 8.3% | 32.0% |
| Range | 8.2% | 31.5% |
| Mean | 2.9% | 3.9% |
| Median | 2.5% | 2.2% |
| Interquartile 25% (IQ1) | 2.2% | 1.7% |
| Interquartile 75% (IQ3) | 3.7% | 2.5% |
| Interquartile Range (IQR) | 1.5% | 0.80% |
| Standard Deviation (Sample) | 1.4% | 6.6% |
| Standard Deviation (Population) | 1.4% | 6.4% |
Demographics Similar to Immigrants from Romania and Immigrants from Hungary by Self-Care Disability
In terms of self-care disability, the demographic groups most similar to Immigrants from Romania are Immigrants from Austria (2.4%, a difference of 0.030%), Polish (2.4%, a difference of 0.050%), Immigrants from South America (2.4%, a difference of 0.050%), Colombian (2.4%, a difference of 0.060%), and Hmong (2.4%, a difference of 0.090%). Similarly, the demographic groups most similar to Immigrants from Hungary are Colombian (2.4%, a difference of 0.010%), Hmong (2.4%, a difference of 0.040%), Immigrants from North America (2.4%, a difference of 0.080%), Immigrants from Morocco (2.4%, a difference of 0.080%), and Immigrants from Austria (2.4%, a difference of 0.080%).
| Demographics | Rating | Rank | Self-Care Disability |
| Immigrants | Canada | 92.0 /100 | #118 | Exceptional 2.4% |
| Immigrants | Sierra Leone | 91.8 /100 | #119 | Exceptional 2.4% |
| Uruguayans | 91.5 /100 | #120 | Exceptional 2.4% |
| Peruvians | 91.3 /100 | #121 | Exceptional 2.4% |
| Belgians | 90.9 /100 | #122 | Exceptional 2.4% |
| Immigrants | Nigeria | 90.3 /100 | #123 | Exceptional 2.4% |
| Immigrants | North America | 90.2 /100 | #124 | Exceptional 2.4% |
| Immigrants | Morocco | 90.2 /100 | #124 | Exceptional 2.4% |
| Hmong | 89.9 /100 | #126 | Excellent 2.4% |
| Colombians | 89.7 /100 | #127 | Excellent 2.4% |
| Immigrants | Hungary | 89.6 /100 | #128 | Excellent 2.4% |
| Immigrants | Romania | 89.3 /100 | #129 | Excellent 2.4% |
| Immigrants | Austria | 89.0 /100 | #130 | Excellent 2.4% |
| Poles | 88.9 /100 | #131 | Excellent 2.4% |
| Immigrants | South America | 88.8 /100 | #132 | Excellent 2.4% |
| Immigrants | Colombia | 88.5 /100 | #133 | Excellent 2.4% |
| Russians | 88.2 /100 | #134 | Excellent 2.4% |
| Laotians | 87.8 /100 | #135 | Excellent 2.4% |
| South American Indians | 87.2 /100 | #136 | Excellent 2.4% |
| Austrians | 87.0 /100 | #137 | Excellent 2.4% |
| Immigrants | Croatia | 86.6 /100 | #138 | Excellent 2.4% |