Immigrants from Romania vs Immigrants from Morocco Disability Age 18 to 34
COMPARE
Immigrants from Romania
Immigrants from Morocco
Disability Age 18 to 34
Disability Age 18 to 34 Comparison
Immigrants from Romania
Immigrants from Morocco
6.3%
DISABILITY AGE 18 TO 34
94.9/ 100
METRIC RATING
112th/ 347
METRIC RANK
6.3%
DISABILITY AGE 18 TO 34
92.9/ 100
METRIC RATING
124th/ 347
METRIC RANK
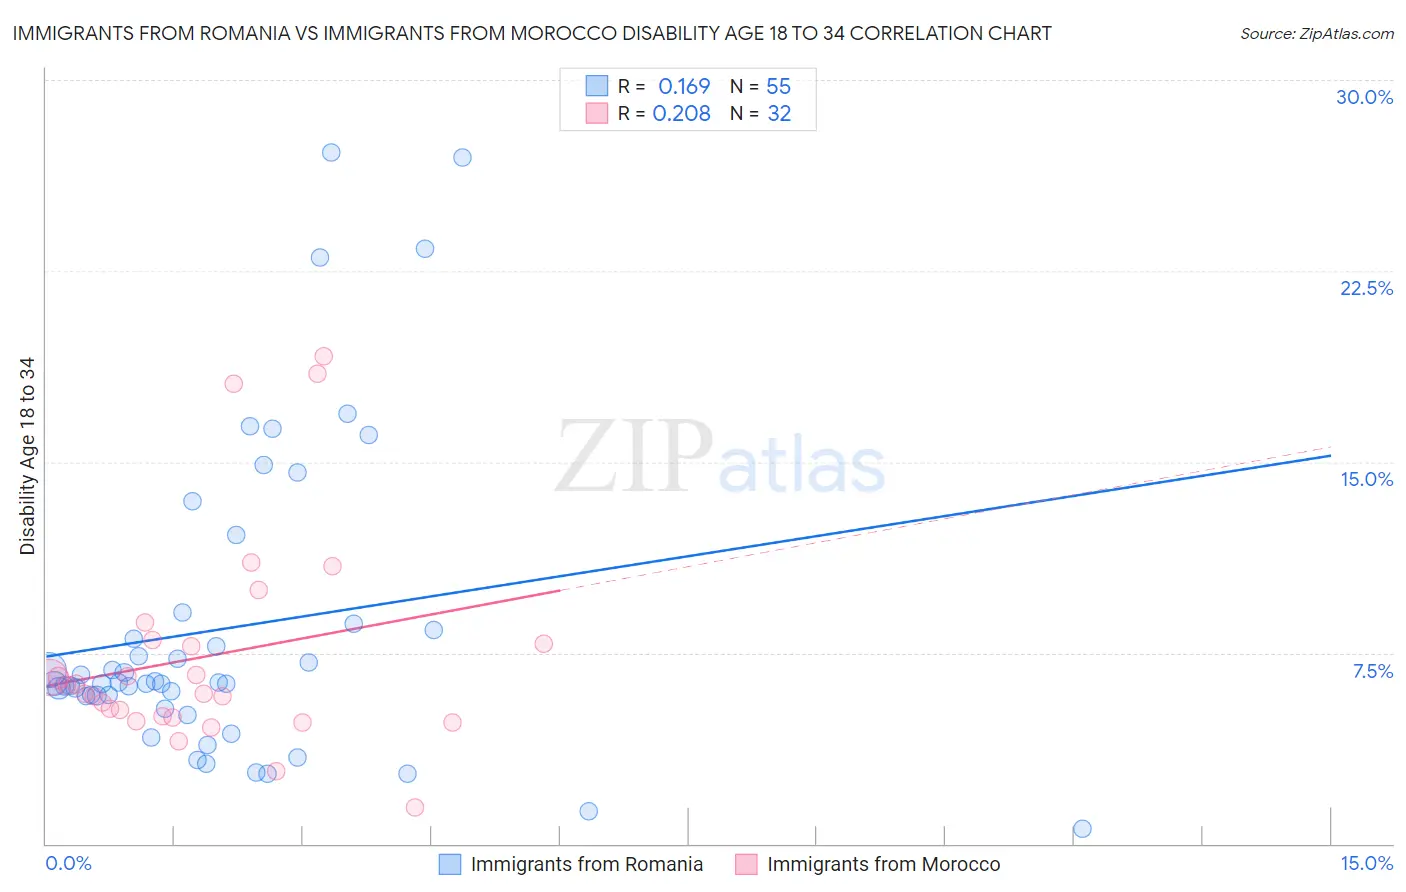
Immigrants from Romania vs Immigrants from Morocco Disability Age 18 to 34 Correlation Chart
The statistical analysis conducted on geographies consisting of 256,653,302 people shows a poor positive correlation between the proportion of Immigrants from Romania and percentage of population with a disability between the ages 18 and 35 in the United States with a correlation coefficient (R) of 0.169 and weighted average of 6.3%. Similarly, the statistical analysis conducted on geographies consisting of 178,772,233 people shows a weak positive correlation between the proportion of Immigrants from Morocco and percentage of population with a disability between the ages 18 and 35 in the United States with a correlation coefficient (R) of 0.208 and weighted average of 6.3%, a difference of 0.66%.
Disability Age 18 to 34 Correlation Summary
| Measurement | Immigrants from Romania | Immigrants from Morocco |
| Minimum | 0.58% | 1.4% |
| Maximum | 27.1% | 19.2% |
| Range | 26.6% | 17.7% |
| Mean | 8.5% | 7.4% |
| Median | 6.3% | 6.1% |
| Interquartile 25% (IQ1) | 5.8% | 5.0% |
| Interquartile 75% (IQ3) | 8.6% | 7.9% |
| Interquartile Range (IQR) | 2.8% | 2.9% |
| Standard Deviation (Sample) | 6.1% | 4.2% |
| Standard Deviation (Population) | 6.0% | 4.1% |
Demographics Similar to Immigrants from Romania and Immigrants from Morocco by Disability Age 18 to 34
In terms of disability age 18 to 34, the demographic groups most similar to Immigrants from Romania are Immigrants from Latin America (6.3%, a difference of 0.0%), Immigrants from France (6.3%, a difference of 0.090%), Immigrants from Brazil (6.3%, a difference of 0.10%), Immigrants from South Eastern Asia (6.3%, a difference of 0.18%), and Sri Lankan (6.2%, a difference of 0.25%). Similarly, the demographic groups most similar to Immigrants from Morocco are Costa Rican (6.3%, a difference of 0.020%), Macedonian (6.3%, a difference of 0.070%), Immigrants from Switzerland (6.3%, a difference of 0.10%), Immigrants from Czechoslovakia (6.3%, a difference of 0.12%), and Immigrants from Guatemala (6.3%, a difference of 0.14%).
| Demographics | Rating | Rank | Disability Age 18 to 34 |
| Immigrants | Croatia | 95.7 /100 | #108 | Exceptional 6.2% |
| Sri Lankans | 95.5 /100 | #109 | Exceptional 6.2% |
| Immigrants | Brazil | 95.2 /100 | #110 | Exceptional 6.3% |
| Immigrants | France | 95.1 /100 | #111 | Exceptional 6.3% |
| Immigrants | Romania | 94.9 /100 | #112 | Exceptional 6.3% |
| Immigrants | Latin America | 94.9 /100 | #113 | Exceptional 6.3% |
| Immigrants | South Eastern Asia | 94.4 /100 | #114 | Exceptional 6.3% |
| Koreans | 94.1 /100 | #115 | Exceptional 6.3% |
| Immigrants | Costa Rica | 94.0 /100 | #116 | Exceptional 6.3% |
| Immigrants | Jordan | 94.0 /100 | #117 | Exceptional 6.3% |
| Immigrants | Nepal | 93.7 /100 | #118 | Exceptional 6.3% |
| Chileans | 93.5 /100 | #119 | Exceptional 6.3% |
| Immigrants | Ukraine | 93.4 /100 | #120 | Exceptional 6.3% |
| Immigrants | Guatemala | 93.4 /100 | #121 | Exceptional 6.3% |
| Immigrants | Czechoslovakia | 93.3 /100 | #122 | Exceptional 6.3% |
| Costa Ricans | 92.9 /100 | #123 | Exceptional 6.3% |
| Immigrants | Morocco | 92.9 /100 | #124 | Exceptional 6.3% |
| Macedonians | 92.6 /100 | #125 | Exceptional 6.3% |
| Immigrants | Switzerland | 92.5 /100 | #126 | Exceptional 6.3% |
| West Indians | 92.0 /100 | #127 | Exceptional 6.3% |
| Chinese | 91.9 /100 | #128 | Exceptional 6.3% |