Immigrants from Panama vs Immigrants from Bahamas Disability Age 35 to 64
COMPARE
Immigrants from Panama
Immigrants from Bahamas
Disability Age 35 to 64
Disability Age 35 to 64 Comparison
Immigrants from Panama
Immigrants from Bahamas
11.6%
DISABILITY AGE 35 TO 64
20.4/ 100
METRIC RATING
198th/ 347
METRIC RANK
11.8%
DISABILITY AGE 35 TO 64
9.2/ 100
METRIC RATING
218th/ 347
METRIC RANK
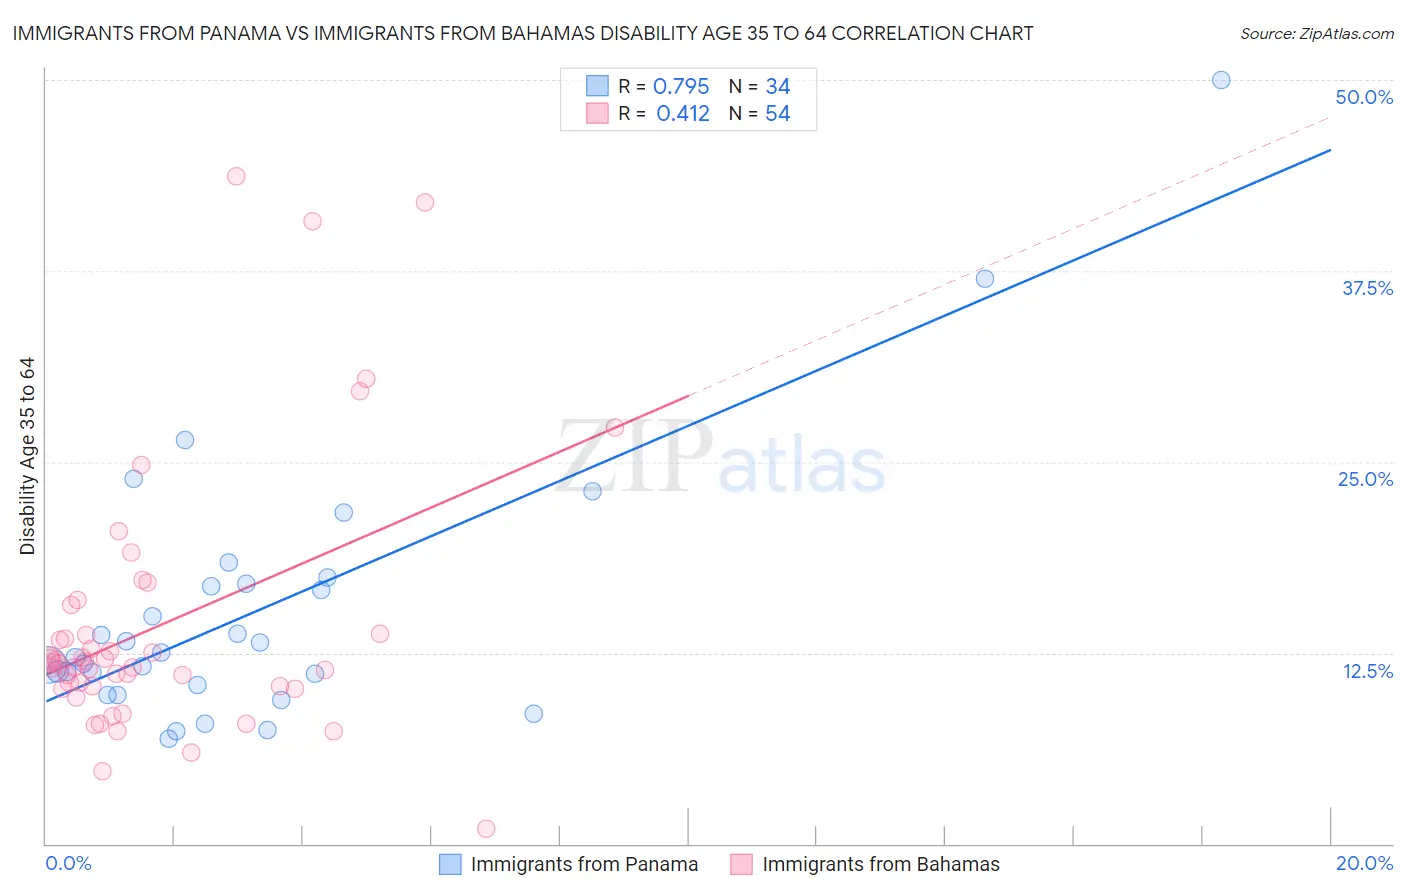
Immigrants from Panama vs Immigrants from Bahamas Disability Age 35 to 64 Correlation Chart
The statistical analysis conducted on geographies consisting of 221,148,326 people shows a strong positive correlation between the proportion of Immigrants from Panama and percentage of population with a disability between the ages 34 and 64 in the United States with a correlation coefficient (R) of 0.795 and weighted average of 11.6%. Similarly, the statistical analysis conducted on geographies consisting of 104,614,213 people shows a moderate positive correlation between the proportion of Immigrants from Bahamas and percentage of population with a disability between the ages 34 and 64 in the United States with a correlation coefficient (R) of 0.412 and weighted average of 11.8%, a difference of 1.8%.
Disability Age 35 to 64 Correlation Summary
| Measurement | Immigrants from Panama | Immigrants from Bahamas |
| Minimum | 6.9% | 0.98% |
| Maximum | 50.0% | 43.7% |
| Range | 43.1% | 42.7% |
| Mean | 15.3% | 14.3% |
| Median | 12.4% | 11.8% |
| Interquartile 25% (IQ1) | 10.4% | 10.3% |
| Interquartile 75% (IQ3) | 17.0% | 13.8% |
| Interquartile Range (IQR) | 6.6% | 3.4% |
| Standard Deviation (Sample) | 8.8% | 8.8% |
| Standard Deviation (Population) | 8.7% | 8.7% |
Demographics Similar to Immigrants from Panama and Immigrants from Bahamas by Disability Age 35 to 64
In terms of disability age 35 to 64, the demographic groups most similar to Immigrants from Panama are Basque (11.6%, a difference of 0.11%), Swiss (11.6%, a difference of 0.21%), Immigrants from Kenya (11.6%, a difference of 0.34%), Immigrants from Guatemala (11.6%, a difference of 0.36%), and British (11.6%, a difference of 0.43%). Similarly, the demographic groups most similar to Immigrants from Bahamas are Barbadian (11.8%, a difference of 0.050%), Bahamian (11.8%, a difference of 0.31%), Spanish American Indian (11.7%, a difference of 0.40%), Immigrants from Sudan (11.7%, a difference of 0.46%), and Yugoslavian (11.7%, a difference of 0.49%).
| Demographics | Rating | Rank | Disability Age 35 to 64 |
| Immigrants | Panama | 20.4 /100 | #198 | Fair 11.6% |
| Basques | 19.5 /100 | #199 | Poor 11.6% |
| Swiss | 18.7 /100 | #200 | Poor 11.6% |
| Immigrants | Kenya | 17.7 /100 | #201 | Poor 11.6% |
| Immigrants | Guatemala | 17.5 /100 | #202 | Poor 11.6% |
| British | 17.0 /100 | #203 | Poor 11.6% |
| Nigerians | 16.3 /100 | #204 | Poor 11.6% |
| Slavs | 15.5 /100 | #205 | Poor 11.7% |
| Native Hawaiians | 14.8 /100 | #206 | Poor 11.7% |
| Ghanaians | 14.8 /100 | #207 | Poor 11.7% |
| Guatemalans | 14.6 /100 | #208 | Poor 11.7% |
| Europeans | 13.5 /100 | #209 | Poor 11.7% |
| Belgians | 13.1 /100 | #210 | Poor 11.7% |
| Canadians | 13.0 /100 | #211 | Poor 11.7% |
| Immigrants | Jamaica | 11.8 /100 | #212 | Poor 11.7% |
| Yugoslavians | 11.6 /100 | #213 | Poor 11.7% |
| Immigrants | Sudan | 11.4 /100 | #214 | Poor 11.7% |
| Spanish American Indians | 11.1 /100 | #215 | Poor 11.7% |
| Bahamians | 10.7 /100 | #216 | Poor 11.8% |
| Barbadians | 9.5 /100 | #217 | Tragic 11.8% |
| Immigrants | Bahamas | 9.2 /100 | #218 | Tragic 11.8% |