Iranian vs Czech Disability Age Over 75
COMPARE
Iranian
Czech
Disability Age Over 75
Disability Age Over 75 Comparison
Iranians
Czechs
45.9%
DISABILITY AGE OVER 75
99.6/ 100
METRIC RATING
59th/ 347
METRIC RANK
45.7%
DISABILITY AGE OVER 75
99.8/ 100
METRIC RATING
43rd/ 347
METRIC RANK
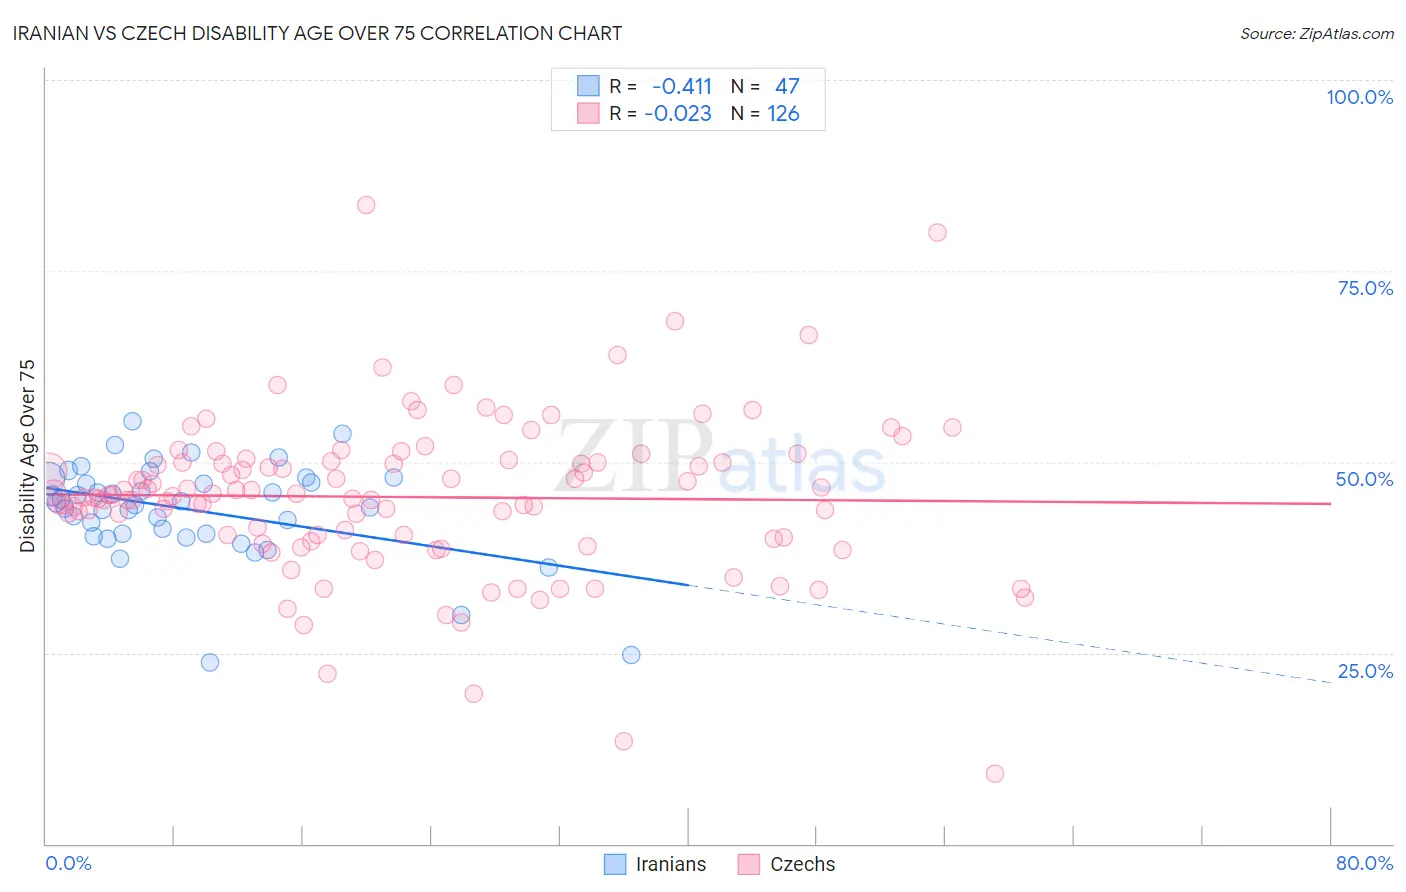
Iranian vs Czech Disability Age Over 75 Correlation Chart
The statistical analysis conducted on geographies consisting of 316,376,826 people shows a moderate negative correlation between the proportion of Iranians and percentage of population with a disability over the age of 75 in the United States with a correlation coefficient (R) of -0.411 and weighted average of 45.9%. Similarly, the statistical analysis conducted on geographies consisting of 483,617,393 people shows no correlation between the proportion of Czechs and percentage of population with a disability over the age of 75 in the United States with a correlation coefficient (R) of -0.023 and weighted average of 45.7%, a difference of 0.52%.
Disability Age Over 75 Correlation Summary
| Measurement | Iranian | Czech |
| Minimum | 23.8% | 9.1% |
| Maximum | 55.3% | 83.6% |
| Range | 31.5% | 74.6% |
| Mean | 43.7% | 45.4% |
| Median | 44.7% | 45.6% |
| Interquartile 25% (IQ1) | 40.5% | 40.1% |
| Interquartile 75% (IQ3) | 47.9% | 50.0% |
| Interquartile Range (IQR) | 7.3% | 9.9% |
| Standard Deviation (Sample) | 6.4% | 10.4% |
| Standard Deviation (Population) | 6.3% | 10.4% |
Demographics Similar to Iranians and Czechs by Disability Age Over 75
In terms of disability age over 75, the demographic groups most similar to Iranians are Immigrants from Europe (45.9%, a difference of 0.0%), Immigrants from Turkey (45.9%, a difference of 0.010%), Immigrants from Israel (45.9%, a difference of 0.010%), Immigrants from Netherlands (45.9%, a difference of 0.020%), and Immigrants from Argentina (45.9%, a difference of 0.020%). Similarly, the demographic groups most similar to Czechs are Greek (45.6%, a difference of 0.0%), Australian (45.7%, a difference of 0.040%), Turkish (45.7%, a difference of 0.040%), Immigrants from Singapore (45.6%, a difference of 0.050%), and Swedish (45.7%, a difference of 0.070%).
| Demographics | Rating | Rank | Disability Age Over 75 |
| Immigrants | Singapore | 99.8 /100 | #41 | Exceptional 45.6% |
| Greeks | 99.8 /100 | #42 | Exceptional 45.6% |
| Czechs | 99.8 /100 | #43 | Exceptional 45.7% |
| Australians | 99.8 /100 | #44 | Exceptional 45.7% |
| Turks | 99.8 /100 | #45 | Exceptional 45.7% |
| Swedes | 99.8 /100 | #46 | Exceptional 45.7% |
| Immigrants | Canada | 99.8 /100 | #47 | Exceptional 45.7% |
| Croatians | 99.8 /100 | #48 | Exceptional 45.7% |
| Immigrants | North America | 99.8 /100 | #49 | Exceptional 45.7% |
| Belgians | 99.7 /100 | #50 | Exceptional 45.8% |
| Immigrants | Korea | 99.7 /100 | #51 | Exceptional 45.8% |
| Immigrants | France | 99.7 /100 | #52 | Exceptional 45.8% |
| Immigrants | Italy | 99.7 /100 | #53 | Exceptional 45.8% |
| Slovaks | 99.6 /100 | #54 | Exceptional 45.8% |
| Maltese | 99.6 /100 | #55 | Exceptional 45.8% |
| Immigrants | Netherlands | 99.6 /100 | #56 | Exceptional 45.9% |
| Immigrants | Turkey | 99.6 /100 | #57 | Exceptional 45.9% |
| Immigrants | Israel | 99.6 /100 | #58 | Exceptional 45.9% |
| Iranians | 99.6 /100 | #59 | Exceptional 45.9% |
| Immigrants | Europe | 99.6 /100 | #60 | Exceptional 45.9% |
| Immigrants | Argentina | 99.6 /100 | #61 | Exceptional 45.9% |