Immigrants from North America vs Immigrants from Dominican Republic Male Disability
COMPARE
Immigrants from North America
Immigrants from Dominican Republic
Male Disability
Male Disability Comparison
Immigrants from North America
Immigrants from Dominican Republic
11.9%
MALE DISABILITY
1.5/ 100
METRIC RATING
235th/ 347
METRIC RANK
11.7%
MALE DISABILITY
4.9/ 100
METRIC RATING
216th/ 347
METRIC RANK
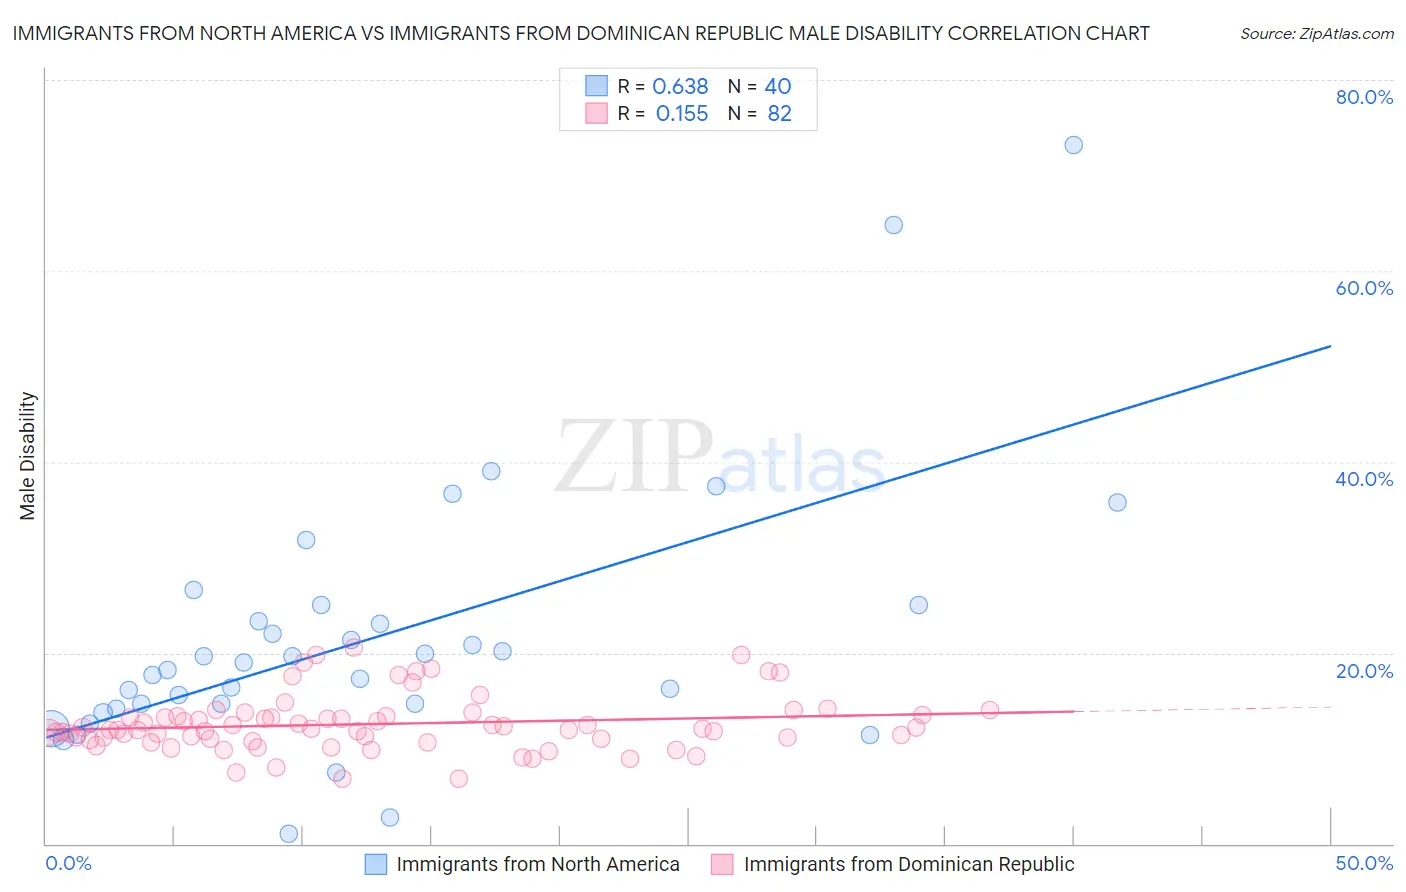
Immigrants from North America vs Immigrants from Dominican Republic Male Disability Correlation Chart
The statistical analysis conducted on geographies consisting of 462,399,243 people shows a significant positive correlation between the proportion of Immigrants from North America and percentage of males with a disability in the United States with a correlation coefficient (R) of 0.638 and weighted average of 11.9%. Similarly, the statistical analysis conducted on geographies consisting of 275,063,348 people shows a poor positive correlation between the proportion of Immigrants from Dominican Republic and percentage of males with a disability in the United States with a correlation coefficient (R) of 0.155 and weighted average of 11.7%, a difference of 1.6%.
Male Disability Correlation Summary
| Measurement | Immigrants from North America | Immigrants from Dominican Republic |
| Minimum | 1.0% | 6.8% |
| Maximum | 73.2% | 20.5% |
| Range | 72.2% | 13.7% |
| Mean | 21.6% | 12.5% |
| Median | 18.6% | 12.0% |
| Interquartile 25% (IQ1) | 14.4% | 11.0% |
| Interquartile 75% (IQ3) | 24.1% | 13.4% |
| Interquartile Range (IQR) | 9.8% | 2.4% |
| Standard Deviation (Sample) | 14.0% | 2.9% |
| Standard Deviation (Population) | 13.8% | 2.9% |
Demographics Similar to Immigrants from North America and Immigrants from Dominican Republic by Male Disability
In terms of male disability, the demographic groups most similar to Immigrants from North America are Immigrants from Canada (11.9%, a difference of 0.13%), Mexican (11.8%, a difference of 0.20%), Malaysian (11.8%, a difference of 0.24%), Dominican (11.8%, a difference of 0.30%), and Croatian (11.8%, a difference of 0.50%). Similarly, the demographic groups most similar to Immigrants from Dominican Republic are Immigrants from Dominica (11.7%, a difference of 0.070%), Indonesian (11.6%, a difference of 0.28%), Immigrants from England (11.7%, a difference of 0.28%), Panamanian (11.7%, a difference of 0.34%), and Immigrants from Western Europe (11.7%, a difference of 0.35%).
| Demographics | Rating | Rank | Male Disability |
| Indonesians | 5.9 /100 | #215 | Tragic 11.6% |
| Immigrants | Dominican Republic | 4.9 /100 | #216 | Tragic 11.7% |
| Immigrants | Dominica | 4.6 /100 | #217 | Tragic 11.7% |
| Immigrants | England | 4.0 /100 | #218 | Tragic 11.7% |
| Panamanians | 3.8 /100 | #219 | Tragic 11.7% |
| Immigrants | Western Europe | 3.8 /100 | #220 | Tragic 11.7% |
| Immigrants | Congo | 3.7 /100 | #221 | Tragic 11.7% |
| Alsatians | 3.3 /100 | #222 | Tragic 11.7% |
| Immigrants | Bahamas | 3.2 /100 | #223 | Tragic 11.7% |
| Japanese | 3.1 /100 | #224 | Tragic 11.7% |
| Liberians | 3.1 /100 | #225 | Tragic 11.8% |
| Sub-Saharan Africans | 2.8 /100 | #226 | Tragic 11.8% |
| Austrians | 2.5 /100 | #227 | Tragic 11.8% |
| Hispanics or Latinos | 2.3 /100 | #228 | Tragic 11.8% |
| Bermudans | 2.3 /100 | #229 | Tragic 11.8% |
| Croatians | 2.1 /100 | #230 | Tragic 11.8% |
| Dominicans | 1.8 /100 | #231 | Tragic 11.8% |
| Malaysians | 1.8 /100 | #232 | Tragic 11.8% |
| Mexicans | 1.7 /100 | #233 | Tragic 11.8% |
| Immigrants | Canada | 1.6 /100 | #234 | Tragic 11.9% |
| Immigrants | North America | 1.5 /100 | #235 | Tragic 11.9% |