Immigrants from Mexico vs Finnish Disability Age 35 to 64
COMPARE
Immigrants from Mexico
Finnish
Disability Age 35 to 64
Disability Age 35 to 64 Comparison
Immigrants from Mexico
Finns
12.1%
DISABILITY AGE 35 TO 64
2.2/ 100
METRIC RATING
245th/ 347
METRIC RANK
12.1%
DISABILITY AGE 35 TO 64
2.3/ 100
METRIC RATING
244th/ 347
METRIC RANK
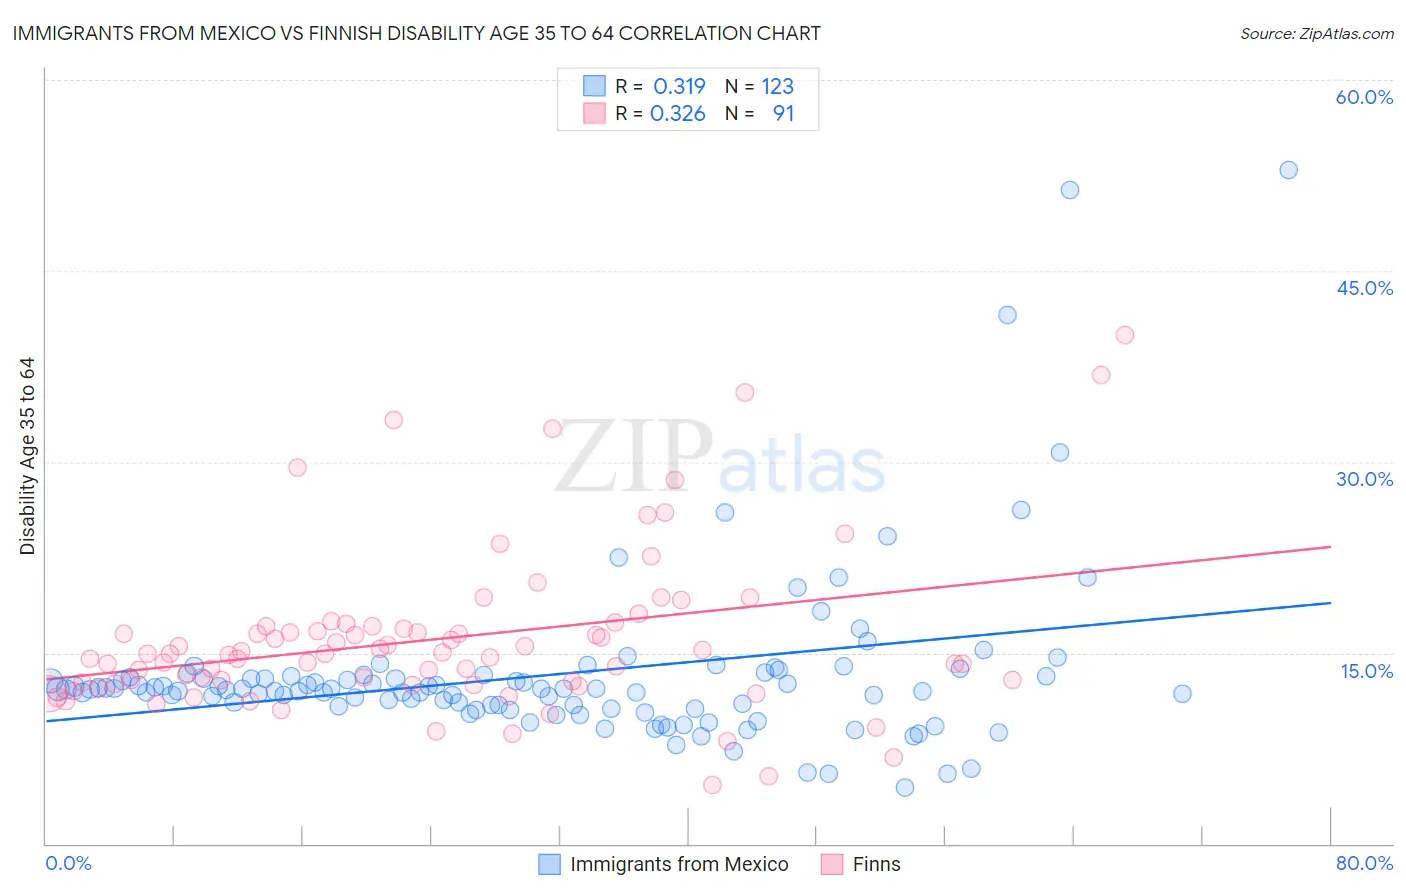
Immigrants from Mexico vs Finnish Disability Age 35 to 64 Correlation Chart
The statistical analysis conducted on geographies consisting of 513,207,045 people shows a mild positive correlation between the proportion of Immigrants from Mexico and percentage of population with a disability between the ages 34 and 64 in the United States with a correlation coefficient (R) of 0.319 and weighted average of 12.1%. Similarly, the statistical analysis conducted on geographies consisting of 404,418,735 people shows a mild positive correlation between the proportion of Finns and percentage of population with a disability between the ages 34 and 64 in the United States with a correlation coefficient (R) of 0.326 and weighted average of 12.1%, a difference of 0.10%.
Disability Age 35 to 64 Correlation Summary
| Measurement | Immigrants from Mexico | Finnish |
| Minimum | 4.4% | 4.6% |
| Maximum | 52.9% | 40.0% |
| Range | 48.5% | 35.4% |
| Mean | 13.3% | 16.1% |
| Median | 12.1% | 14.9% |
| Interquartile 25% (IQ1) | 10.8% | 12.5% |
| Interquartile 75% (IQ3) | 13.2% | 17.1% |
| Interquartile Range (IQR) | 2.3% | 4.5% |
| Standard Deviation (Sample) | 6.8% | 6.4% |
| Standard Deviation (Population) | 6.8% | 6.4% |
Demographics Similar to Immigrants from Mexico and Finns by Disability Age 35 to 64
In terms of disability age 35 to 64, the demographic groups most similar to Immigrants from Mexico are Slovak (12.1%, a difference of 0.36%), Samoan (12.1%, a difference of 0.46%), Mexican American Indian (12.0%, a difference of 0.73%), Immigrants from Thailand (12.0%, a difference of 0.75%), and Immigrants from Western Africa (12.0%, a difference of 0.76%). Similarly, the demographic groups most similar to Finns are Slovak (12.1%, a difference of 0.26%), Samoan (12.1%, a difference of 0.36%), Mexican American Indian (12.0%, a difference of 0.63%), Immigrants from Thailand (12.0%, a difference of 0.65%), and Immigrants from Western Africa (12.0%, a difference of 0.66%).
| Demographics | Rating | Rank | Disability Age 35 to 64 |
| Portuguese | 4.9 /100 | #234 | Tragic 11.9% |
| Belizeans | 4.5 /100 | #235 | Tragic 12.0% |
| Immigrants | Middle Africa | 4.5 /100 | #236 | Tragic 12.0% |
| Immigrants | Cambodia | 3.9 /100 | #237 | Tragic 12.0% |
| West Indians | 3.7 /100 | #238 | Tragic 12.0% |
| Immigrants | Western Africa | 3.3 /100 | #239 | Tragic 12.0% |
| Immigrants | Thailand | 3.3 /100 | #240 | Tragic 12.0% |
| Mexican American Indians | 3.2 /100 | #241 | Tragic 12.0% |
| Samoans | 2.8 /100 | #242 | Tragic 12.1% |
| Slovaks | 2.7 /100 | #243 | Tragic 12.1% |
| Finns | 2.3 /100 | #244 | Tragic 12.1% |
| Immigrants | Mexico | 2.2 /100 | #245 | Tragic 12.1% |
| Guamanians/Chamorros | 1.4 /100 | #246 | Tragic 12.2% |
| Immigrants | Senegal | 1.3 /100 | #247 | Tragic 12.2% |
| Spaniards | 1.3 /100 | #248 | Tragic 12.3% |
| Hispanics or Latinos | 1.3 /100 | #249 | Tragic 12.3% |
| Immigrants | Burma/Myanmar | 1.2 /100 | #250 | Tragic 12.3% |
| Germans | 1.1 /100 | #251 | Tragic 12.3% |
| Irish | 1.0 /100 | #252 | Tragic 12.3% |
| Dutch | 1.0 /100 | #253 | Tragic 12.3% |
| Hawaiians | 0.9 /100 | #254 | Tragic 12.3% |