Immigrants from Malaysia vs Immigrants from Japan Disability Age Over 75

COMPARE

Immigrants from Malaysia
Race
Ancestry
AfghanAfricanAlaska NativeAlaskan AthabascanAlbanianAleutAlsatianAmericanApacheArabArapahoArgentineanArmenianAssyrian/Chaldean/SyriacAustralianAustrianBahamianBangladeshiBarbadianBasqueBelgianBelizeanBermudanBhutaneseBlackfeetBolivianBrazilianBritishBritish West IndianBulgarianBurmeseCajunCambodianCanadianCape VerdeanCarpatho RusynCelticCentral AmericanCentral American IndianCherokeeCheyenneChickasawChileanChineseChippewaChoctawColombianColvilleComancheCosta RicanCreeCreekCroatianCrowCubanCypriotCzechCzechoslovakianDanishDelawareDominicanDutchDutch West IndianEastern EuropeanEcuadorianEgyptianEnglishEstonianEthiopianEuropeanFijianFilipinoFinnishFrenchFrench American IndianFrench CanadianGermanGerman RussianGhanaianGreekGuamanian/ChamorroGuatemalanGuyaneseHaitianHmongHonduranHopiHoumaHungarianIcelanderIndian (Asian)IndonesianInupiatIranianIraqiIrishIroquoisIsraeliItalianJamaicanJapaneseJordanianKenyanKiowaKoreanLaotianLatvianLebaneseLiberianLithuanianLumbeeLuxembourgerMacedonianMalaysianMalteseMarshalleseMenomineeMexicanMexican American IndianMongolianMoroccanNative HawaiianNavajoNepaleseNew ZealanderNicaraguanNigerianNorthern EuropeanNorwegianOkinawanOsageOttawaPaiutePakistaniPalestinianPanamanianParaguayanPennsylvania GermanPeruvianPimaPolishPortuguesePotawatomiPuebloPuerto RicanPuget Sound SalishRomanianRussianSalvadoranSamoanScandinavianScotch-IrishScottishSeminoleSenegaleseSerbianShoshoneSierra LeoneanSiouxSlavicSlovakSloveneSomaliSouth AfricanSouth AmericanSouth American IndianSoviet UnionSpaniardSpanishSpanish AmericanSpanish American IndianSri LankanSubsaharan AfricanSudaneseSwedishSwissSyrianTaiwaneseThaiTlingit-HaidaTohono O'OdhamTonganTrinidadian and TobagonianTsimshianTurkishU.S. Virgin IslanderUgandanUkrainianUruguayanUteVenezuelanVietnameseWelshWest IndianYakamaYaquiYugoslavianYumanYup'ikZimbabwean
Immigration
NonimmigrantsImmigrantsAfghanistanAfricaAlbaniaArgentinaArmeniaAsiaAustraliaAustriaBahamasBangladeshBarbadosBelarusBelgiumBelizeBoliviaBosnia and HerzegovinaBrazilBulgariaBurma/MyanmarCabo VerdeCambodiaCameroonCanadaCaribbeanCentral AmericaChileChinaColombiaCongoCosta RicaCroatiaCubaCzechoslovakiaDenmarkDominicaDominican RepublicEastern AfricaEastern AsiaEastern EuropeEcuadorEgyptEl SalvadorEnglandEritreaEthiopiaEuropeFijiFranceGermanyGhanaGreeceGrenadaGuatemalaGuyanaHaitiHondurasHong KongHungaryIndiaIndonesiaIranIraqIrelandIsraelItalyJamaicaJordanKazakhstanKenyaKoreaKuwaitLaosLatin AmericaLatviaLebanonLiberiaLithuaniaMalaysiaMexicoMicronesiaMiddle AfricaMoldovaMoroccoNepalNetherlandsNicaraguaNigeriaNorth AmericaNorth MacedoniaNorthern AfricaNorthern EuropeNorwayOceaniaPakistanPanamaPeruPhilippinesPolandPortugalRomaniaRussiaSaudi ArabiaScotlandSenegalSerbiaSierra LeoneSingaporeSomaliaSouth AfricaSouth AmericaSouth Central AsiaSouth Eastern AsiaSouthern EuropeSpainSri LankaSt. Vincent and the GrenadinesSudanSwedenSwitzerlandSyriaTaiwanThailandTrinidad and TobagoTurkeyUgandaUkraineUruguayUzbekistanVenezuelaVietnamWest IndiesWestern AfricaWestern AsiaWestern EuropeYemenZaireZimbabweAzores
Immigrants from Japan
Race
Ancestry
AfghanAfricanAlaska NativeAlaskan AthabascanAlbanianAleutAlsatianAmericanApacheArabArapahoArgentineanArmenianAssyrian/Chaldean/SyriacAustralianAustrianBahamianBangladeshiBarbadianBasqueBelgianBelizeanBermudanBhutaneseBlackfeetBolivianBrazilianBritishBritish West IndianBulgarianBurmeseCajunCambodianCanadianCape VerdeanCarpatho RusynCelticCentral AmericanCentral American IndianCherokeeCheyenneChickasawChileanChineseChippewaChoctawColombianColvilleComancheCosta RicanCreeCreekCroatianCrowCubanCypriotCzechCzechoslovakianDanishDelawareDominicanDutchDutch West IndianEastern EuropeanEcuadorianEgyptianEnglishEstonianEthiopianEuropeanFijianFilipinoFinnishFrenchFrench American IndianFrench CanadianGermanGerman RussianGhanaianGreekGuamanian/ChamorroGuatemalanGuyaneseHaitianHmongHonduranHopiHoumaHungarianIcelanderIndian (Asian)IndonesianInupiatIranianIraqiIrishIroquoisIsraeliItalianJamaicanJapaneseJordanianKenyanKiowaKoreanLaotianLatvianLebaneseLiberianLithuanianLumbeeLuxembourgerMacedonianMalaysianMalteseMarshalleseMenomineeMexicanMexican American IndianMongolianMoroccanNative HawaiianNavajoNepaleseNew ZealanderNicaraguanNigerianNorthern EuropeanNorwegianOkinawanOsageOttawaPaiutePakistaniPalestinianPanamanianParaguayanPennsylvania GermanPeruvianPimaPolishPortuguesePotawatomiPuebloPuerto RicanPuget Sound SalishRomanianRussianSalvadoranSamoanScandinavianScotch-IrishScottishSeminoleSenegaleseSerbianShoshoneSierra LeoneanSiouxSlavicSlovakSloveneSomaliSouth AfricanSouth AmericanSouth American IndianSoviet UnionSpaniardSpanishSpanish AmericanSpanish American IndianSri LankanSubsaharan AfricanSudaneseSwedishSwissSyrianTaiwaneseThaiTlingit-HaidaTohono O'OdhamTonganTrinidadian and TobagonianTsimshianTurkishU.S. Virgin IslanderUgandanUkrainianUruguayanUteVenezuelanVietnameseWelshWest IndianYakamaYaquiYugoslavianYumanYup'ikZimbabwean
Immigration
NonimmigrantsImmigrantsAfghanistanAfricaAlbaniaArgentinaArmeniaAsiaAustraliaAustriaBahamasBangladeshBarbadosBelarusBelgiumBelizeBoliviaBosnia and HerzegovinaBrazilBulgariaBurma/MyanmarCabo VerdeCambodiaCameroonCanadaCaribbeanCentral AmericaChileChinaColombiaCongoCosta RicaCroatiaCubaCzechoslovakiaDenmarkDominicaDominican RepublicEastern AfricaEastern AsiaEastern EuropeEcuadorEgyptEl SalvadorEnglandEritreaEthiopiaEuropeFijiFranceGermanyGhanaGreeceGrenadaGuatemalaGuyanaHaitiHondurasHong KongHungaryIndiaIndonesiaIranIraqIrelandIsraelItalyJamaicaJapanJordanKazakhstanKenyaKoreaKuwaitLaosLatin AmericaLatviaLebanonLiberiaLithuaniaMexicoMicronesiaMiddle AfricaMoldovaMoroccoNepalNetherlandsNicaraguaNigeriaNorth AmericaNorth MacedoniaNorthern AfricaNorthern EuropeNorwayOceaniaPakistanPanamaPeruPhilippinesPolandPortugalRomaniaRussiaSaudi ArabiaScotlandSenegalSerbiaSierra LeoneSingaporeSomaliaSouth AfricaSouth AmericaSouth Central AsiaSouth Eastern AsiaSouthern EuropeSpainSri LankaSt. Vincent and the GrenadinesSudanSwedenSwitzerlandSyriaTaiwanThailandTrinidad and TobagoTurkeyUgandaUkraineUruguayUzbekistanVenezuelaVietnamWest IndiesWestern AfricaWestern AsiaWestern EuropeYemenZaireZimbabweAzores
Disability Age Over 75
Income
Poverty
Unemployment
Labor Participation
Family Structure
Vehicle Availability
Education Level
Disability

Disability Age Over 75 Comparison

Immigrants from Malaysia

Immigrants from Japan

Exceptional
Exceptional
46.4%
DISABILITY AGE OVER 75
97.1/ 100
METRIC RATING
102nd/ 347
METRIC RANK
46.3%
DISABILITY AGE OVER 75
97.8/ 100
METRIC RATING
98th/ 347
METRIC RANK

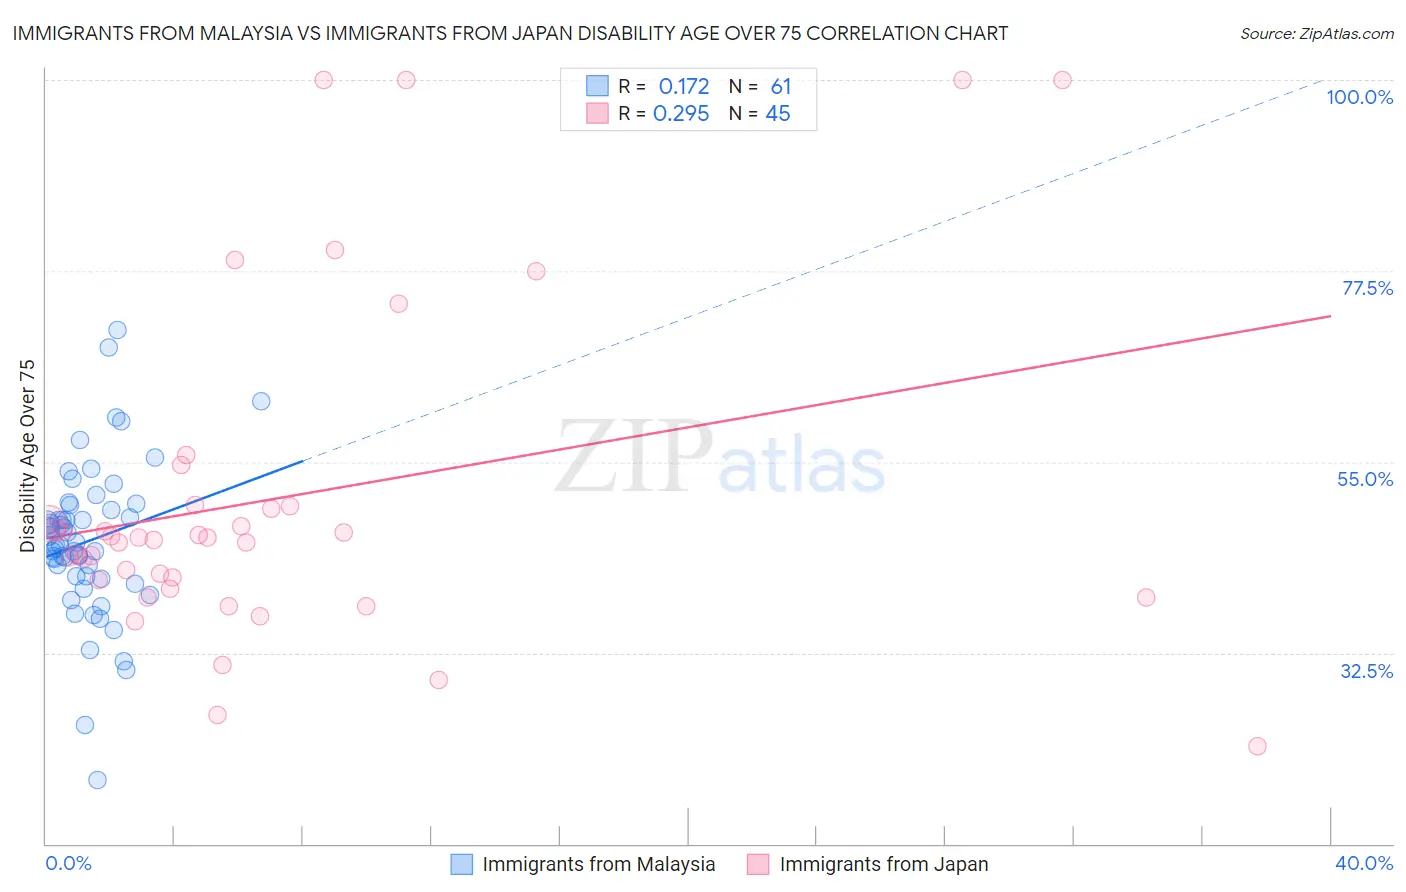
Immigrants from Malaysia vs Immigrants from Japan Disability Age Over 75 Correlation Chart

The statistical analysis conducted on geographies consisting of 197,852,473 people shows a poor positive correlation between the proportion of Immigrants from Malaysia and percentage of population with a disability over the age of 75 in the United States with a correlation coefficient (R) of 0.172 and weighted average of 46.4%. Similarly, the statistical analysis conducted on geographies consisting of 339,657,036 people shows a weak positive correlation between the proportion of Immigrants from Japan and percentage of population with a disability over the age of 75 in the United States with a correlation coefficient (R) of 0.295 and weighted average of 46.3%, a difference of 0.16%.
Immigrants from Malaysia vs Immigrants from Japan Disability Age Over 75

Disability Age Over 75 Correlation Summary

MeasurementImmigrants from MalaysiaImmigrants from Japan
Minimum17.5%21.4%
Maximum70.6%100.0%
Range53.1%78.6%
Mean45.6%50.9%
Median45.2%46.1%
Interquartile 25% (IQ1)41.4%40.6%
Interquartile 75% (IQ3)49.7%49.8%
Interquartile Range (IQR)8.3%9.2%
Standard Deviation (Sample)9.1%19.6%
Standard Deviation (Population)9.0%19.4%

Demographics Similar to Immigrants from Malaysia and Immigrants from Japan by Disability Age Over 75

In terms of disability age over 75, the demographic groups most similar to Immigrants from Malaysia are Ukrainian (46.4%, a difference of 0.010%), Israeli (46.4%, a difference of 0.020%), Immigrants from Cameroon (46.4%, a difference of 0.050%), Immigrants from Kuwait (46.4%, a difference of 0.060%), and Immigrants from Uruguay (46.4%, a difference of 0.090%). Similarly, the demographic groups most similar to Immigrants from Japan are Finnish (46.3%, a difference of 0.010%), Immigrants from China (46.3%, a difference of 0.030%), Immigrants from Brazil (46.3%, a difference of 0.040%), Palestinian (46.3%, a difference of 0.040%), and Immigrants from Eastern Europe (46.3%, a difference of 0.040%).
DemographicsRating | RankDisability Age Over 75
Northern Europeans
98.3
/100
|
#90
Exceptional
46.3%
Immigrants | Egypt
98.3
/100
|
#91
Exceptional
46.3%
Germans
98.2
/100
|
#92
Exceptional
46.3%
Ugandans
98.2
/100
|
#93
Exceptional
46.3%
Albanians
98.1
/100
|
#94
Exceptional
46.3%
Immigrants | Brazil
98.0
/100
|
#95
Exceptional
46.3%
Immigrants | China
98.0
/100
|
#96
Exceptional
46.3%
Finns
97.9
/100
|
#97
Exceptional
46.3%
Immigrants | Japan
97.8
/100
|
#98
Exceptional
46.3%
Palestinians
97.7
/100
|
#99
Exceptional
46.3%
Immigrants | Eastern Europe
97.7
/100
|
#100
Exceptional
46.3%
Mongolians
97.7
/100
|
#101
Exceptional
46.3%
Immigrants | Malaysia
97.1
/100
|
#102
Exceptional
46.4%
Ukrainians
97.1
/100
|
#103
Exceptional
46.4%
Israelis
97.0
/100
|
#104
Exceptional
46.4%
Immigrants | Cameroon
96.9
/100
|
#105
Exceptional
46.4%
Immigrants | Kuwait
96.8
/100
|
#106
Exceptional
46.4%
Immigrants | Uruguay
96.7
/100
|
#107
Exceptional
46.4%
Brazilians
96.6
/100
|
#108
Exceptional
46.5%
Chileans
96.4
/100
|
#109
Exceptional
46.5%
Immigrants | Hong Kong
96.4
/100
|
#110
Exceptional
46.5%