Immigrants from Lebanon vs Maltese Disability
COMPARE
Immigrants from Lebanon
Maltese
Disability
Disability Comparison
Immigrants from Lebanon
Maltese
11.0%
DISABILITY
99.4/ 100
METRIC RATING
71st/ 347
METRIC RANK
11.7%
DISABILITY
50.6/ 100
METRIC RATING
173rd/ 347
METRIC RANK
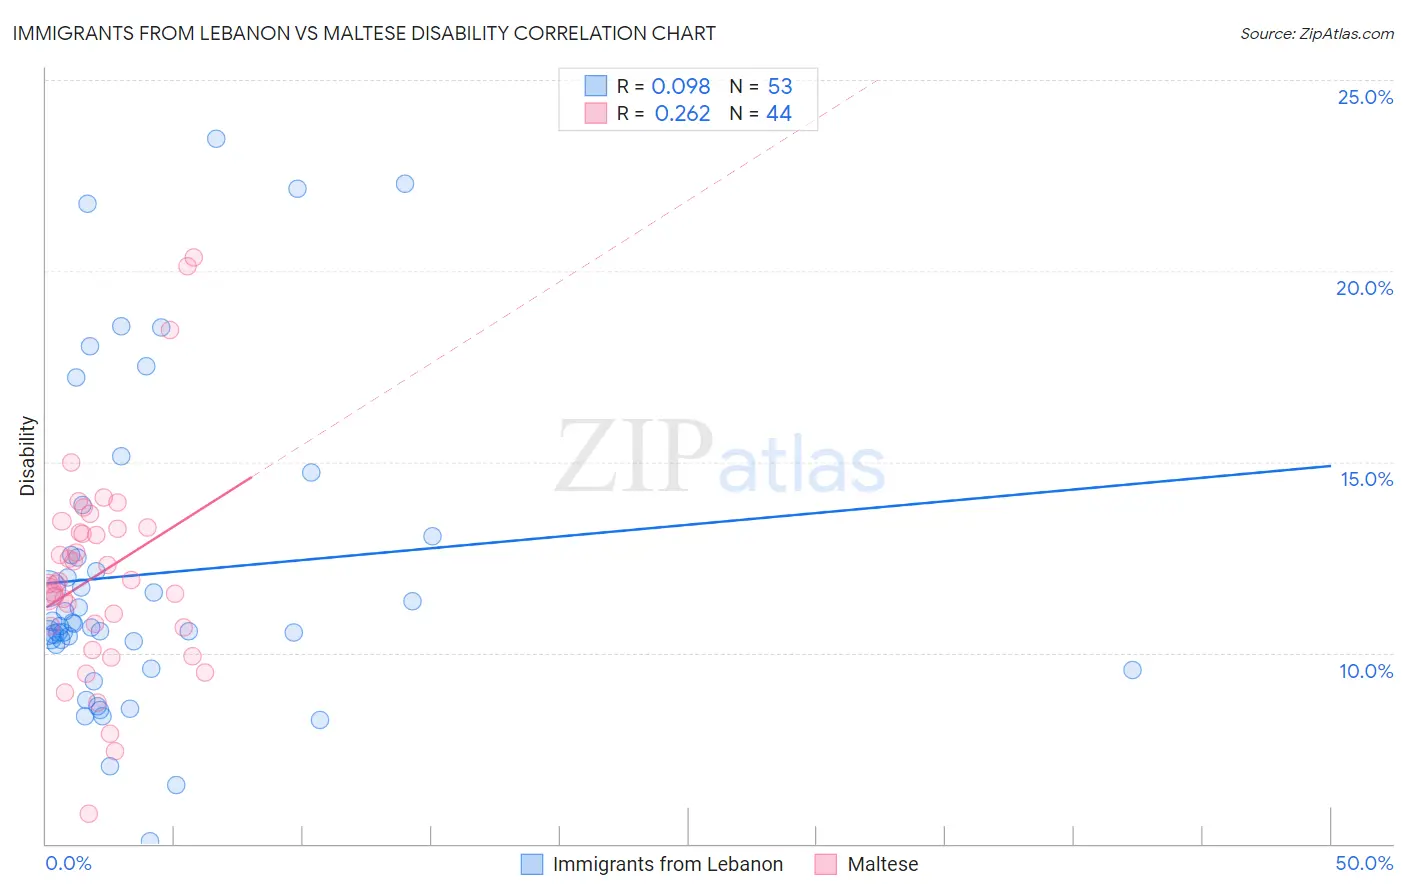
Immigrants from Lebanon vs Maltese Disability Correlation Chart
The statistical analysis conducted on geographies consisting of 217,153,550 people shows a slight positive correlation between the proportion of Immigrants from Lebanon and percentage of population with a disability in the United States with a correlation coefficient (R) of 0.098 and weighted average of 11.0%. Similarly, the statistical analysis conducted on geographies consisting of 126,476,999 people shows a weak positive correlation between the proportion of Maltese and percentage of population with a disability in the United States with a correlation coefficient (R) of 0.262 and weighted average of 11.7%, a difference of 6.0%.
Disability Correlation Summary
| Measurement | Immigrants from Lebanon | Maltese |
| Minimum | 5.1% | 5.8% |
| Maximum | 23.5% | 20.3% |
| Range | 18.4% | 14.5% |
| Mean | 12.1% | 12.1% |
| Median | 10.7% | 11.8% |
| Interquartile 25% (IQ1) | 9.9% | 10.7% |
| Interquartile 75% (IQ3) | 12.8% | 13.3% |
| Interquartile Range (IQR) | 2.9% | 2.6% |
| Standard Deviation (Sample) | 4.1% | 2.8% |
| Standard Deviation (Population) | 4.1% | 2.8% |
Similar Demographics by Disability
Demographics Similar to Immigrants from Lebanon by Disability
In terms of disability, the demographic groups most similar to Immigrants from Lebanon are Immigrants from France (11.0%, a difference of 0.020%), Sri Lankan (11.0%, a difference of 0.090%), Immigrants from Chile (11.0%, a difference of 0.090%), Immigrants from Bangladesh (11.0%, a difference of 0.11%), and Immigrants from Serbia (11.0%, a difference of 0.13%).
| Demographics | Rating | Rank | Disability |
| Immigrants | Sweden | 99.6 /100 | #64 | Exceptional 11.0% |
| Bulgarians | 99.6 /100 | #65 | Exceptional 11.0% |
| Laotians | 99.6 /100 | #66 | Exceptional 11.0% |
| Colombians | 99.6 /100 | #67 | Exceptional 11.0% |
| Immigrants | Afghanistan | 99.6 /100 | #68 | Exceptional 11.0% |
| Sri Lankans | 99.5 /100 | #69 | Exceptional 11.0% |
| Immigrants | France | 99.4 /100 | #70 | Exceptional 11.0% |
| Immigrants | Lebanon | 99.4 /100 | #71 | Exceptional 11.0% |
| Immigrants | Chile | 99.4 /100 | #72 | Exceptional 11.0% |
| Immigrants | Bangladesh | 99.4 /100 | #73 | Exceptional 11.0% |
| Immigrants | Serbia | 99.4 /100 | #74 | Exceptional 11.0% |
| Immigrants | Vietnam | 99.4 /100 | #75 | Exceptional 11.0% |
| Sierra Leoneans | 99.3 /100 | #76 | Exceptional 11.0% |
| Immigrants | Belgium | 99.3 /100 | #77 | Exceptional 11.0% |
| Immigrants | Cameroon | 99.3 /100 | #78 | Exceptional 11.1% |
Demographics Similar to Maltese by Disability
In terms of disability, the demographic groups most similar to Maltese are Albanian (11.7%, a difference of 0.030%), Trinidadian and Tobagonian (11.7%, a difference of 0.090%), Haitian (11.7%, a difference of 0.090%), Immigrants from Albania (11.7%, a difference of 0.10%), and Immigrants from Southern Europe (11.7%, a difference of 0.10%).
| Demographics | Rating | Rank | Disability |
| Pakistanis | 54.7 /100 | #166 | Average 11.7% |
| Estonians | 54.4 /100 | #167 | Average 11.7% |
| Immigrants | Latin America | 54.1 /100 | #168 | Average 11.7% |
| Immigrants | Austria | 53.4 /100 | #169 | Average 11.7% |
| Immigrants | Albania | 52.8 /100 | #170 | Average 11.7% |
| Immigrants | Southern Europe | 52.8 /100 | #171 | Average 11.7% |
| Trinidadians and Tobagonians | 52.7 /100 | #172 | Average 11.7% |
| Maltese | 50.6 /100 | #173 | Average 11.7% |
| Albanians | 50.0 /100 | #174 | Average 11.7% |
| Haitians | 48.6 /100 | #175 | Average 11.7% |
| Immigrants | Western Africa | 47.5 /100 | #176 | Average 11.7% |
| Immigrants | Central America | 46.6 /100 | #177 | Average 11.7% |
| Greeks | 46.2 /100 | #178 | Average 11.7% |
| Immigrants | Armenia | 41.9 /100 | #179 | Average 11.7% |
| Immigrants | Honduras | 37.8 /100 | #180 | Fair 11.8% |