Immigrants from Jordan vs Immigrants from Iran Disability Age 35 to 64
COMPARE
Immigrants from Jordan
Immigrants from Iran
Disability Age 35 to 64
Disability Age 35 to 64 Comparison
Immigrants from Jordan
Immigrants from Iran
10.4%
DISABILITY AGE 35 TO 64
98.1/ 100
METRIC RATING
100th/ 347
METRIC RANK
8.5%
DISABILITY AGE 35 TO 64
100.0/ 100
METRIC RATING
5th/ 347
METRIC RANK
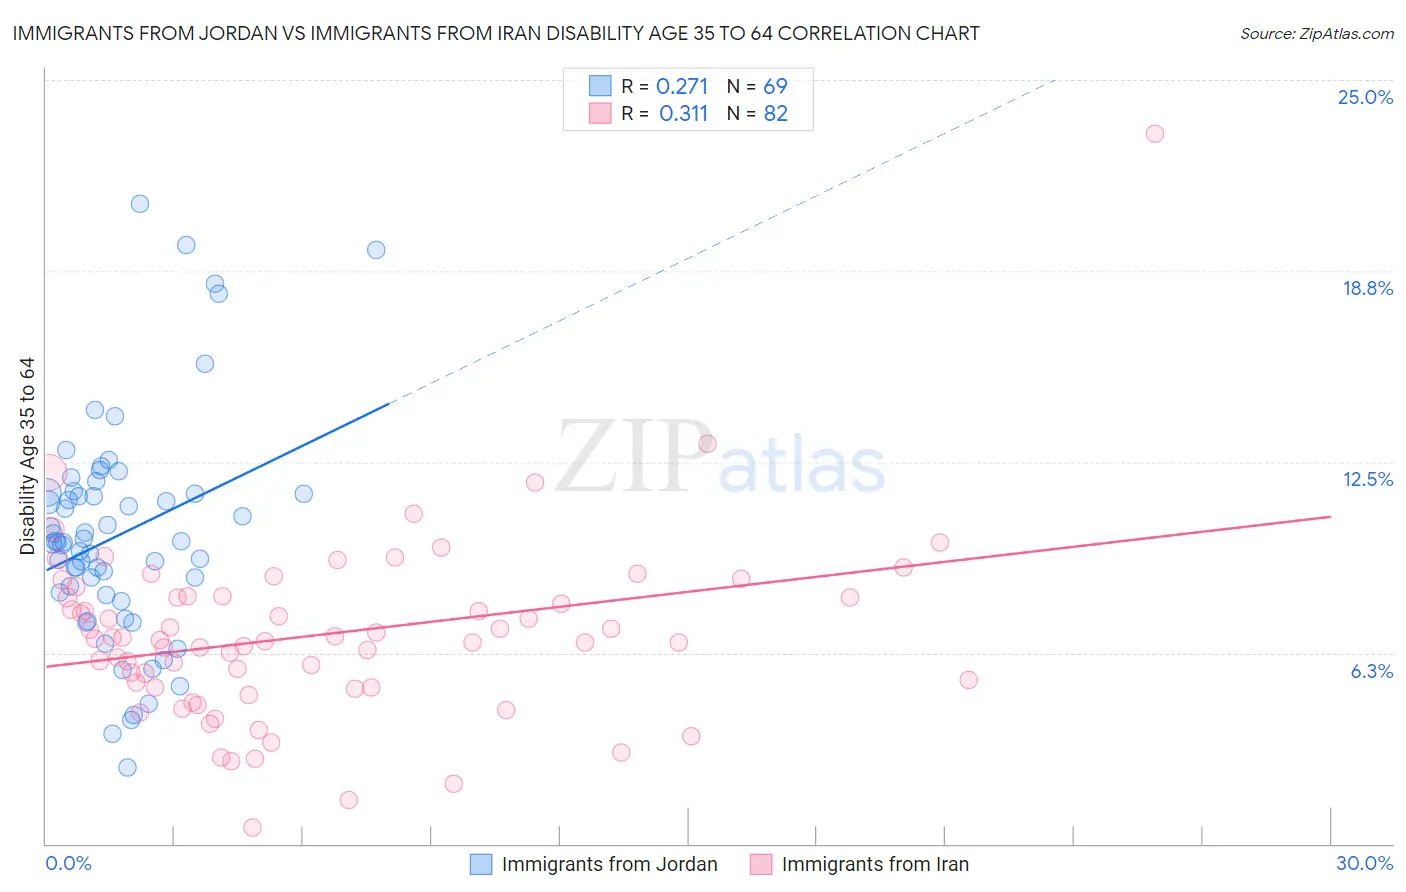
Immigrants from Jordan vs Immigrants from Iran Disability Age 35 to 64 Correlation Chart
The statistical analysis conducted on geographies consisting of 181,250,474 people shows a weak positive correlation between the proportion of Immigrants from Jordan and percentage of population with a disability between the ages 34 and 64 in the United States with a correlation coefficient (R) of 0.271 and weighted average of 10.4%. Similarly, the statistical analysis conducted on geographies consisting of 279,816,013 people shows a mild positive correlation between the proportion of Immigrants from Iran and percentage of population with a disability between the ages 34 and 64 in the United States with a correlation coefficient (R) of 0.311 and weighted average of 8.5%, a difference of 22.3%.
Disability Age 35 to 64 Correlation Summary
| Measurement | Immigrants from Jordan | Immigrants from Iran |
| Minimum | 2.5% | 0.52% |
| Maximum | 20.9% | 23.3% |
| Range | 18.5% | 22.7% |
| Mean | 10.1% | 6.8% |
| Median | 9.9% | 6.7% |
| Interquartile 25% (IQ1) | 8.2% | 5.1% |
| Interquartile 75% (IQ3) | 11.5% | 8.1% |
| Interquartile Range (IQR) | 3.3% | 3.0% |
| Standard Deviation (Sample) | 3.7% | 3.0% |
| Standard Deviation (Population) | 3.6% | 3.0% |
Similar Demographics by Disability Age 35 to 64
Demographics Similar to Immigrants from Jordan by Disability Age 35 to 64
In terms of disability age 35 to 64, the demographic groups most similar to Immigrants from Jordan are Immigrants from Philippines (10.4%, a difference of 0.050%), Immigrants from Western Asia (10.4%, a difference of 0.11%), Immigrants from Ukraine (10.4%, a difference of 0.14%), Palestinian (10.4%, a difference of 0.22%), and Immigrants from Austria (10.4%, a difference of 0.28%).
| Demographics | Rating | Rank | Disability Age 35 to 64 |
| Immigrants | North Macedonia | 98.7 /100 | #93 | Exceptional 10.3% |
| Immigrants | Italy | 98.7 /100 | #94 | Exceptional 10.3% |
| Chinese | 98.7 /100 | #95 | Exceptional 10.3% |
| Immigrants | South Africa | 98.5 /100 | #96 | Exceptional 10.3% |
| Immigrants | Denmark | 98.4 /100 | #97 | Exceptional 10.3% |
| Immigrants | Uruguay | 98.3 /100 | #98 | Exceptional 10.3% |
| Palestinians | 98.2 /100 | #99 | Exceptional 10.4% |
| Immigrants | Jordan | 98.1 /100 | #100 | Exceptional 10.4% |
| Immigrants | Philippines | 98.0 /100 | #101 | Exceptional 10.4% |
| Immigrants | Western Asia | 98.0 /100 | #102 | Exceptional 10.4% |
| Immigrants | Ukraine | 97.9 /100 | #103 | Exceptional 10.4% |
| Immigrants | Austria | 97.8 /100 | #104 | Exceptional 10.4% |
| Macedonians | 97.8 /100 | #105 | Exceptional 10.4% |
| Immigrants | Hungary | 97.6 /100 | #106 | Exceptional 10.4% |
| Zimbabweans | 97.4 /100 | #107 | Exceptional 10.4% |
Demographics Similar to Immigrants from Iran by Disability Age 35 to 64
In terms of disability age 35 to 64, the demographic groups most similar to Immigrants from Iran are Thai (8.6%, a difference of 1.0%), Immigrants from Israel (8.6%, a difference of 1.4%), Iranian (8.7%, a difference of 2.0%), Immigrants from China (8.7%, a difference of 2.5%), and Immigrants from India (8.3%, a difference of 2.5%).
| Demographics | Rating | Rank | Disability Age 35 to 64 |
| Immigrants | Taiwan | 100.0 /100 | #1 | Exceptional 7.8% |
| Filipinos | 100.0 /100 | #2 | Exceptional 8.0% |
| Immigrants | Hong Kong | 100.0 /100 | #3 | Exceptional 8.2% |
| Immigrants | India | 100.0 /100 | #4 | Exceptional 8.3% |
| Immigrants | Iran | 100.0 /100 | #5 | Exceptional 8.5% |
| Thais | 100.0 /100 | #6 | Exceptional 8.6% |
| Immigrants | Israel | 100.0 /100 | #7 | Exceptional 8.6% |
| Iranians | 100.0 /100 | #8 | Exceptional 8.7% |
| Immigrants | China | 100.0 /100 | #9 | Exceptional 8.7% |
| Immigrants | Bolivia | 100.0 /100 | #10 | Exceptional 8.7% |
| Immigrants | Eastern Asia | 100.0 /100 | #11 | Exceptional 8.8% |
| Indians (Asian) | 100.0 /100 | #12 | Exceptional 8.9% |
| Immigrants | South Central Asia | 100.0 /100 | #13 | Exceptional 8.9% |
| Immigrants | Singapore | 100.0 /100 | #14 | Exceptional 8.9% |
| Bolivians | 100.0 /100 | #15 | Exceptional 8.9% |