Cambodian vs Immigrants from Iran Disability Age 35 to 64
COMPARE
Cambodian
Immigrants from Iran
Disability Age 35 to 64
Disability Age 35 to 64 Comparison
Cambodians
Immigrants from Iran
9.8%
DISABILITY AGE 35 TO 64
99.8/ 100
METRIC RATING
46th/ 347
METRIC RANK
8.5%
DISABILITY AGE 35 TO 64
100.0/ 100
METRIC RATING
5th/ 347
METRIC RANK
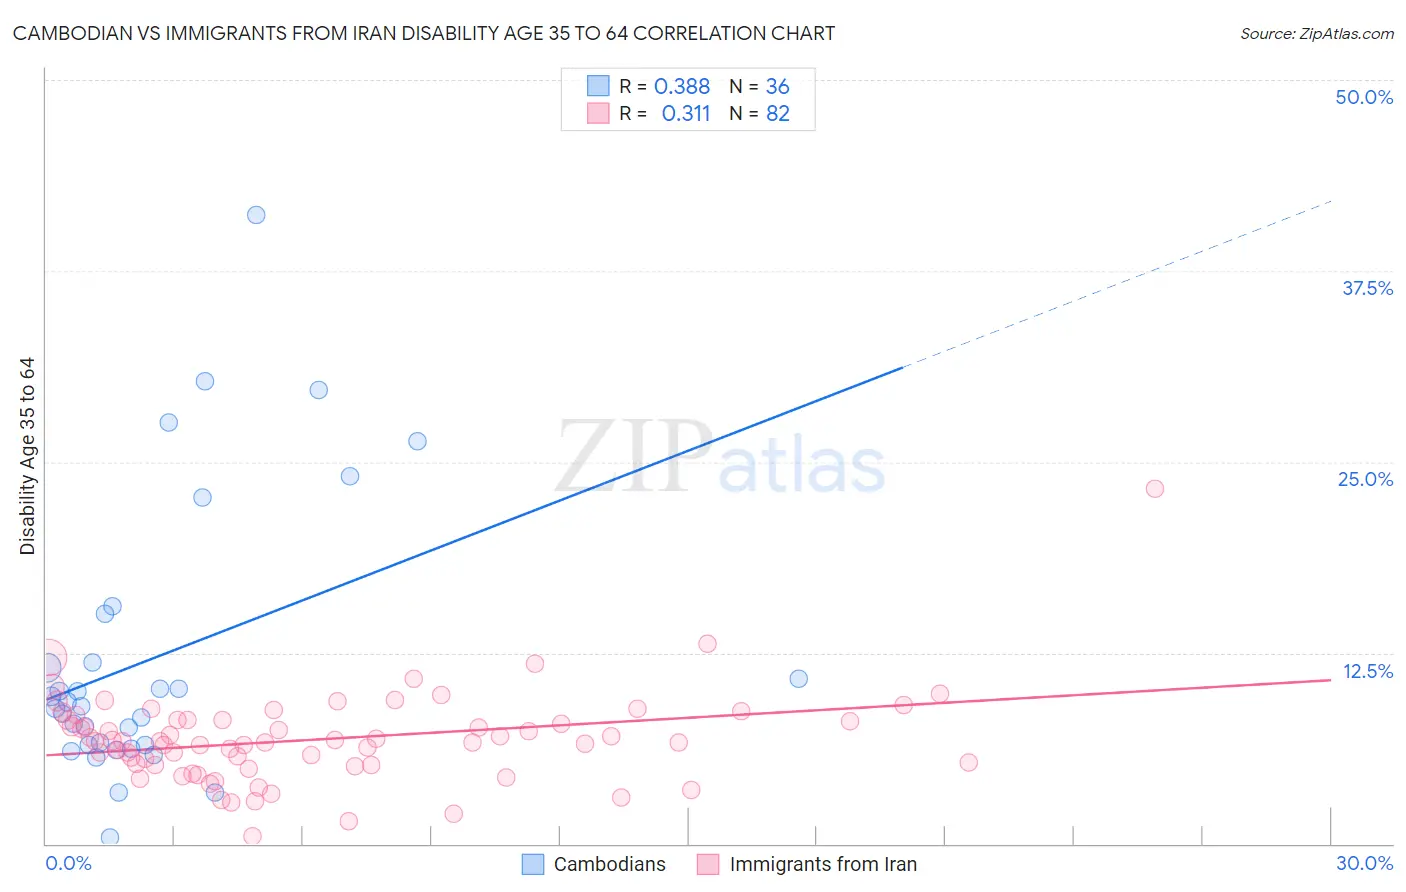
Cambodian vs Immigrants from Iran Disability Age 35 to 64 Correlation Chart
The statistical analysis conducted on geographies consisting of 102,476,211 people shows a mild positive correlation between the proportion of Cambodians and percentage of population with a disability between the ages 34 and 64 in the United States with a correlation coefficient (R) of 0.388 and weighted average of 9.8%. Similarly, the statistical analysis conducted on geographies consisting of 279,816,013 people shows a mild positive correlation between the proportion of Immigrants from Iran and percentage of population with a disability between the ages 34 and 64 in the United States with a correlation coefficient (R) of 0.311 and weighted average of 8.5%, a difference of 15.6%.
Disability Age 35 to 64 Correlation Summary
| Measurement | Cambodian | Immigrants from Iran |
| Minimum | 0.38% | 0.52% |
| Maximum | 41.2% | 23.3% |
| Range | 40.8% | 22.7% |
| Mean | 12.2% | 6.8% |
| Median | 9.1% | 6.7% |
| Interquartile 25% (IQ1) | 6.5% | 5.1% |
| Interquartile 75% (IQ3) | 13.5% | 8.1% |
| Interquartile Range (IQR) | 7.0% | 3.0% |
| Standard Deviation (Sample) | 9.1% | 3.0% |
| Standard Deviation (Population) | 9.0% | 3.0% |
Similar Demographics by Disability Age 35 to 64
Demographics Similar to Cambodians by Disability Age 35 to 64
In terms of disability age 35 to 64, the demographic groups most similar to Cambodians are Immigrants from Belgium (9.8%, a difference of 0.050%), Immigrants from Serbia (9.8%, a difference of 0.060%), Immigrants from Greece (9.8%, a difference of 0.11%), Immigrants from Peru (9.8%, a difference of 0.18%), and Paraguayan (9.8%, a difference of 0.18%).
| Demographics | Rating | Rank | Disability Age 35 to 64 |
| Immigrants | Belarus | 99.9 /100 | #39 | Exceptional 9.7% |
| Immigrants | Armenia | 99.9 /100 | #40 | Exceptional 9.7% |
| Israelis | 99.9 /100 | #41 | Exceptional 9.7% |
| Immigrants | Malaysia | 99.9 /100 | #42 | Exceptional 9.7% |
| Immigrants | Colombia | 99.9 /100 | #43 | Exceptional 9.8% |
| Immigrants | Egypt | 99.9 /100 | #44 | Exceptional 9.8% |
| Immigrants | Peru | 99.9 /100 | #45 | Exceptional 9.8% |
| Cambodians | 99.8 /100 | #46 | Exceptional 9.8% |
| Immigrants | Belgium | 99.8 /100 | #47 | Exceptional 9.8% |
| Immigrants | Serbia | 99.8 /100 | #48 | Exceptional 9.8% |
| Immigrants | Greece | 99.8 /100 | #49 | Exceptional 9.8% |
| Paraguayans | 99.8 /100 | #50 | Exceptional 9.8% |
| Bhutanese | 99.8 /100 | #51 | Exceptional 9.8% |
| Immigrants | Bulgaria | 99.8 /100 | #52 | Exceptional 9.8% |
| Taiwanese | 99.8 /100 | #53 | Exceptional 9.8% |
Demographics Similar to Immigrants from Iran by Disability Age 35 to 64
In terms of disability age 35 to 64, the demographic groups most similar to Immigrants from Iran are Thai (8.6%, a difference of 1.0%), Immigrants from Israel (8.6%, a difference of 1.4%), Iranian (8.7%, a difference of 2.0%), Immigrants from China (8.7%, a difference of 2.5%), and Immigrants from India (8.3%, a difference of 2.5%).
| Demographics | Rating | Rank | Disability Age 35 to 64 |
| Immigrants | Taiwan | 100.0 /100 | #1 | Exceptional 7.8% |
| Filipinos | 100.0 /100 | #2 | Exceptional 8.0% |
| Immigrants | Hong Kong | 100.0 /100 | #3 | Exceptional 8.2% |
| Immigrants | India | 100.0 /100 | #4 | Exceptional 8.3% |
| Immigrants | Iran | 100.0 /100 | #5 | Exceptional 8.5% |
| Thais | 100.0 /100 | #6 | Exceptional 8.6% |
| Immigrants | Israel | 100.0 /100 | #7 | Exceptional 8.6% |
| Iranians | 100.0 /100 | #8 | Exceptional 8.7% |
| Immigrants | China | 100.0 /100 | #9 | Exceptional 8.7% |
| Immigrants | Bolivia | 100.0 /100 | #10 | Exceptional 8.7% |
| Immigrants | Eastern Asia | 100.0 /100 | #11 | Exceptional 8.8% |
| Indians (Asian) | 100.0 /100 | #12 | Exceptional 8.9% |
| Immigrants | South Central Asia | 100.0 /100 | #13 | Exceptional 8.9% |
| Immigrants | Singapore | 100.0 /100 | #14 | Exceptional 8.9% |
| Bolivians | 100.0 /100 | #15 | Exceptional 8.9% |