Immigrants from Hong Kong vs Samoan Female Disability
COMPARE
Immigrants from Hong Kong
Samoan
Female Disability
Female Disability Comparison
Immigrants from Hong Kong
Samoans
10.6%
FEMALE DISABILITY
100.0/ 100
METRIC RATING
10th/ 347
METRIC RANK
12.4%
FEMALE DISABILITY
13.4/ 100
METRIC RATING
215th/ 347
METRIC RANK
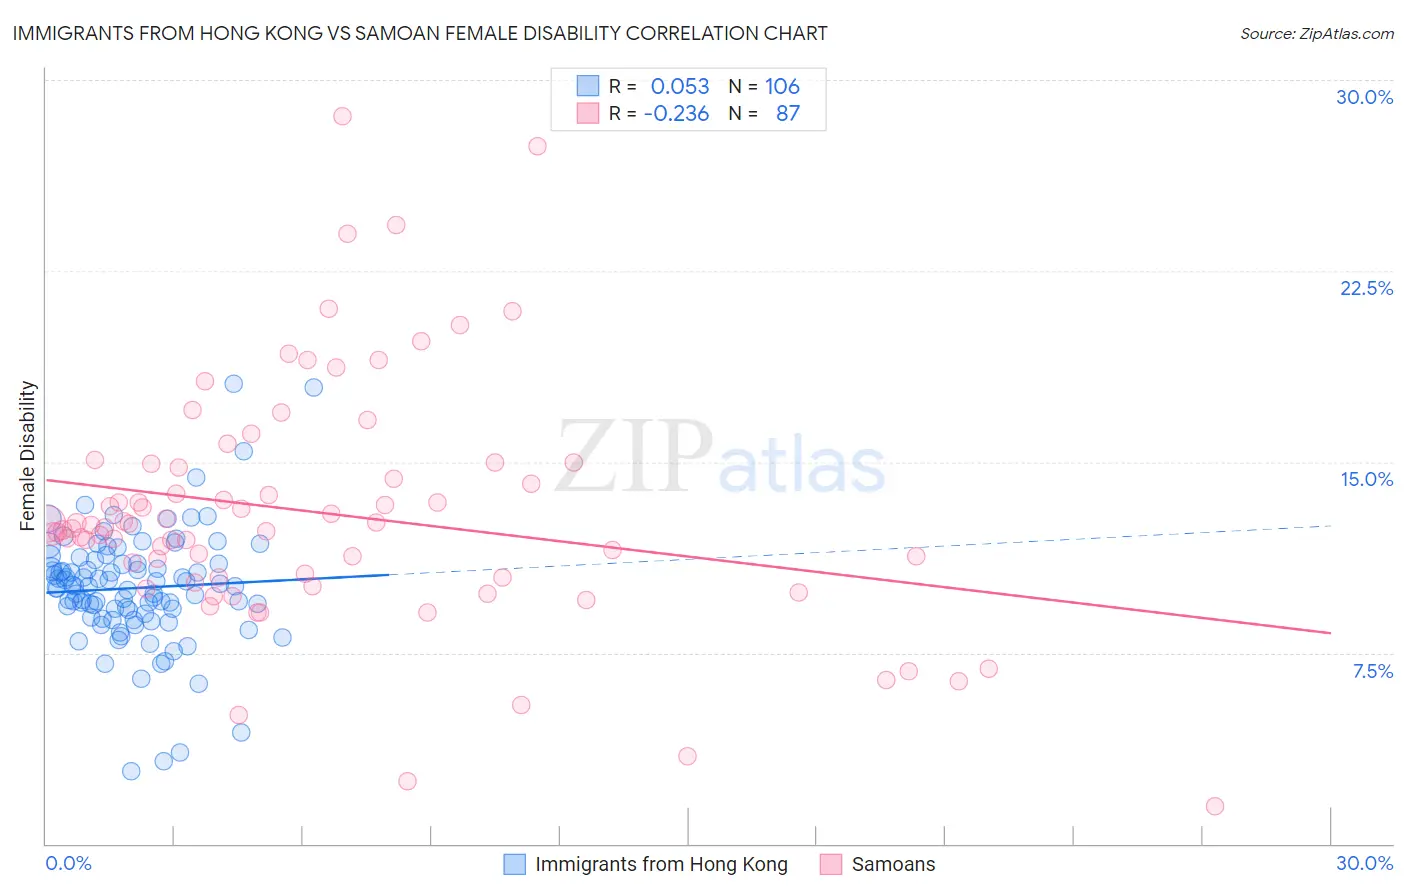
Immigrants from Hong Kong vs Samoan Female Disability Correlation Chart
The statistical analysis conducted on geographies consisting of 253,994,726 people shows a slight positive correlation between the proportion of Immigrants from Hong Kong and percentage of females with a disability in the United States with a correlation coefficient (R) of 0.053 and weighted average of 10.6%. Similarly, the statistical analysis conducted on geographies consisting of 225,122,232 people shows a weak negative correlation between the proportion of Samoans and percentage of females with a disability in the United States with a correlation coefficient (R) of -0.236 and weighted average of 12.4%, a difference of 16.8%.
Female Disability Correlation Summary
| Measurement | Immigrants from Hong Kong | Samoan |
| Minimum | 2.9% | 1.5% |
| Maximum | 18.1% | 28.6% |
| Range | 15.2% | 27.1% |
| Mean | 10.0% | 13.0% |
| Median | 10.1% | 12.4% |
| Interquartile 25% (IQ1) | 9.0% | 10.4% |
| Interquartile 75% (IQ3) | 11.0% | 14.9% |
| Interquartile Range (IQR) | 2.0% | 4.5% |
| Standard Deviation (Sample) | 2.3% | 4.8% |
| Standard Deviation (Population) | 2.3% | 4.8% |
Similar Demographics by Female Disability
Demographics Similar to Immigrants from Hong Kong by Female Disability
In terms of female disability, the demographic groups most similar to Immigrants from Hong Kong are Immigrants from Korea (10.6%, a difference of 0.17%), Immigrants from Israel (10.7%, a difference of 0.59%), Iranian (10.6%, a difference of 0.65%), Immigrants from Eastern Asia (10.7%, a difference of 0.66%), and Immigrants from China (10.7%, a difference of 0.69%).
| Demographics | Rating | Rank | Female Disability |
| Immigrants | Taiwan | 100.0 /100 | #3 | Exceptional 10.1% |
| Thais | 100.0 /100 | #4 | Exceptional 10.2% |
| Immigrants | Bolivia | 100.0 /100 | #5 | Exceptional 10.3% |
| Bolivians | 100.0 /100 | #6 | Exceptional 10.4% |
| Immigrants | Singapore | 100.0 /100 | #7 | Exceptional 10.4% |
| Immigrants | South Central Asia | 100.0 /100 | #8 | Exceptional 10.5% |
| Iranians | 100.0 /100 | #9 | Exceptional 10.6% |
| Immigrants | Hong Kong | 100.0 /100 | #10 | Exceptional 10.6% |
| Immigrants | Korea | 100.0 /100 | #11 | Exceptional 10.6% |
| Immigrants | Israel | 100.0 /100 | #12 | Exceptional 10.7% |
| Immigrants | Eastern Asia | 100.0 /100 | #13 | Exceptional 10.7% |
| Immigrants | China | 100.0 /100 | #14 | Exceptional 10.7% |
| Burmese | 100.0 /100 | #15 | Exceptional 10.7% |
| Okinawans | 100.0 /100 | #16 | Exceptional 10.8% |
| Indians (Asian) | 100.0 /100 | #17 | Exceptional 10.8% |
Demographics Similar to Samoans by Female Disability
In terms of female disability, the demographic groups most similar to Samoans are Panamanian (12.4%, a difference of 0.0%), Immigrants from Burma/Myanmar (12.4%, a difference of 0.010%), British (12.4%, a difference of 0.060%), Immigrants from Thailand (12.4%, a difference of 0.080%), and Immigrants from Bahamas (12.4%, a difference of 0.080%).
| Demographics | Rating | Rank | Female Disability |
| Basques | 17.5 /100 | #208 | Poor 12.4% |
| Mexicans | 15.7 /100 | #209 | Poor 12.4% |
| Swiss | 14.9 /100 | #210 | Poor 12.4% |
| Immigrants | Bosnia and Herzegovina | 14.8 /100 | #211 | Poor 12.4% |
| Ute | 14.7 /100 | #212 | Poor 12.4% |
| Immigrants | Thailand | 14.5 /100 | #213 | Poor 12.4% |
| Panamanians | 13.5 /100 | #214 | Poor 12.4% |
| Samoans | 13.4 /100 | #215 | Poor 12.4% |
| Immigrants | Burma/Myanmar | 13.3 /100 | #216 | Poor 12.4% |
| British | 12.7 /100 | #217 | Poor 12.4% |
| Immigrants | Bahamas | 12.5 /100 | #218 | Poor 12.4% |
| Europeans | 12.1 /100 | #219 | Poor 12.4% |
| Bahamians | 11.1 /100 | #220 | Poor 12.4% |
| Native Hawaiians | 10.8 /100 | #221 | Poor 12.4% |
| Italians | 10.7 /100 | #222 | Poor 12.4% |