Immigrants from Nigeria vs Immigrants from Uganda Disability Age 35 to 64
COMPARE
Immigrants from Nigeria
Immigrants from Uganda
Disability Age 35 to 64
Disability Age 35 to 64 Comparison
Immigrants from Nigeria
Immigrants from Uganda
11.4%
DISABILITY AGE 35 TO 64
32.5/ 100
METRIC RATING
190th/ 347
METRIC RANK
11.2%
DISABILITY AGE 35 TO 64
58.0/ 100
METRIC RATING
170th/ 347
METRIC RANK
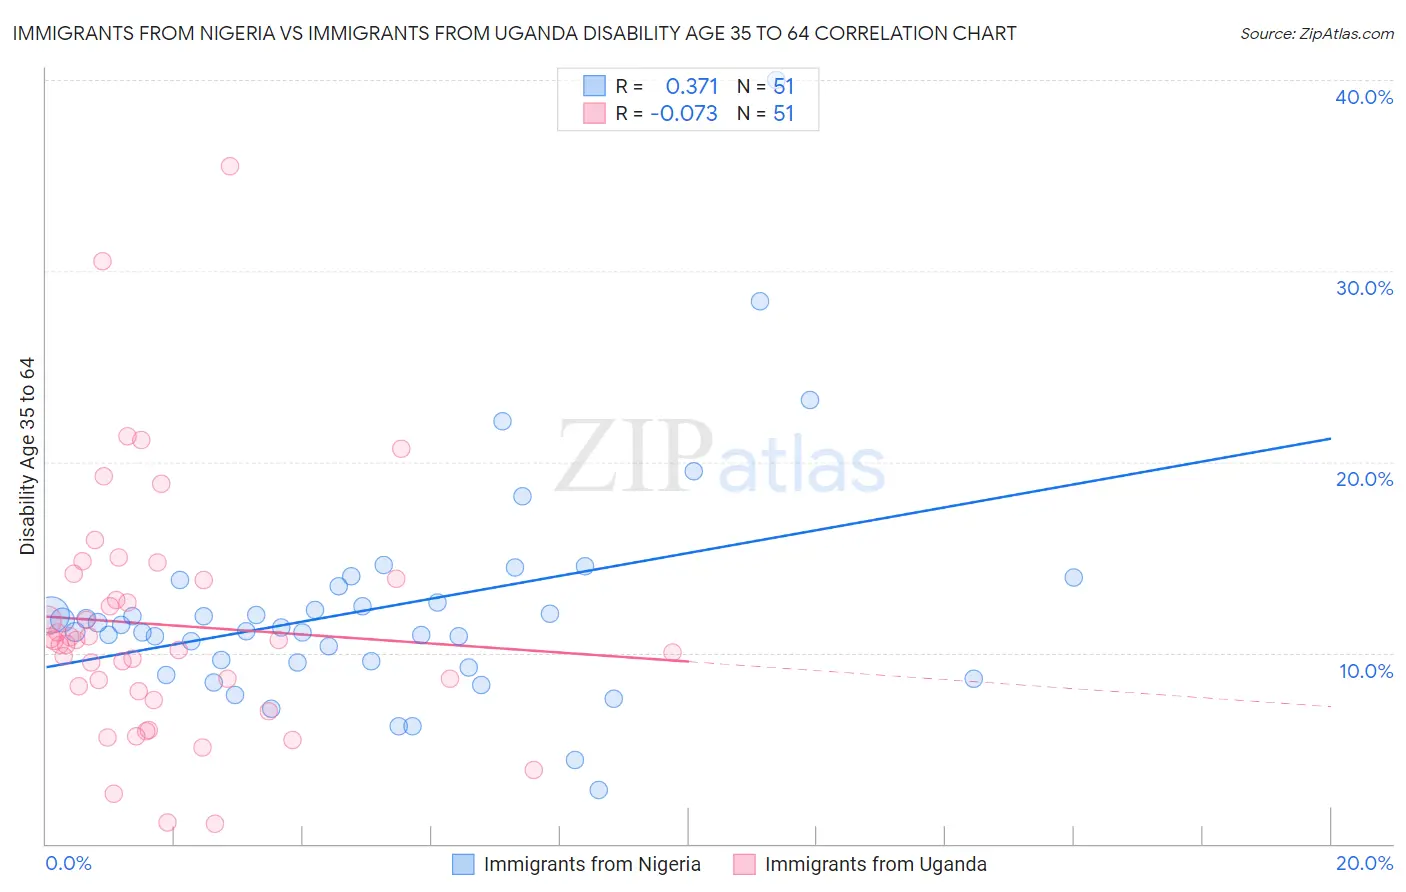
Immigrants from Nigeria vs Immigrants from Uganda Disability Age 35 to 64 Correlation Chart
The statistical analysis conducted on geographies consisting of 283,291,539 people shows a mild positive correlation between the proportion of Immigrants from Nigeria and percentage of population with a disability between the ages 34 and 64 in the United States with a correlation coefficient (R) of 0.371 and weighted average of 11.4%. Similarly, the statistical analysis conducted on geographies consisting of 125,969,840 people shows a slight negative correlation between the proportion of Immigrants from Uganda and percentage of population with a disability between the ages 34 and 64 in the United States with a correlation coefficient (R) of -0.073 and weighted average of 11.2%, a difference of 2.1%.
Disability Age 35 to 64 Correlation Summary
| Measurement | Immigrants from Nigeria | Immigrants from Uganda |
| Minimum | 2.8% | 1.1% |
| Maximum | 40.0% | 35.5% |
| Range | 37.2% | 34.4% |
| Mean | 12.3% | 11.5% |
| Median | 11.3% | 10.6% |
| Interquartile 25% (IQ1) | 9.5% | 8.0% |
| Interquartile 75% (IQ3) | 13.5% | 13.9% |
| Interquartile Range (IQR) | 4.0% | 5.9% |
| Standard Deviation (Sample) | 5.9% | 6.4% |
| Standard Deviation (Population) | 5.9% | 6.4% |
Demographics Similar to Immigrants from Nigeria and Immigrants from Uganda by Disability Age 35 to 64
In terms of disability age 35 to 64, the demographic groups most similar to Immigrants from Nigeria are Hungarian (11.4%, a difference of 0.19%), Northern European (11.4%, a difference of 0.21%), Immigrants from Bosnia and Herzegovina (11.4%, a difference of 0.24%), Slovene (11.4%, a difference of 0.36%), and Danish (11.4%, a difference of 0.38%). Similarly, the demographic groups most similar to Immigrants from Uganda are Immigrants from Trinidad and Tobago (11.2%, a difference of 0.17%), Italian (11.2%, a difference of 0.19%), Lebanese (11.3%, a difference of 0.51%), Immigrants from Fiji (11.3%, a difference of 0.65%), and Czech (11.3%, a difference of 0.82%).
| Demographics | Rating | Rank | Disability Age 35 to 64 |
| Immigrants | Uganda | 58.0 /100 | #170 | Average 11.2% |
| Immigrants | Trinidad and Tobago | 55.9 /100 | #171 | Average 11.2% |
| Italians | 55.6 /100 | #172 | Average 11.2% |
| Lebanese | 51.8 /100 | #173 | Average 11.3% |
| Immigrants | Fiji | 50.0 /100 | #174 | Average 11.3% |
| Czechs | 47.9 /100 | #175 | Average 11.3% |
| Ugandans | 43.7 /100 | #176 | Average 11.3% |
| Immigrants | Eastern Africa | 42.2 /100 | #177 | Average 11.3% |
| Poles | 42.0 /100 | #178 | Average 11.3% |
| Immigrants | Barbados | 41.6 /100 | #179 | Average 11.3% |
| Immigrants | Caribbean | 41.5 /100 | #180 | Average 11.3% |
| Trinidadians and Tobagonians | 40.8 /100 | #181 | Average 11.4% |
| Icelanders | 39.7 /100 | #182 | Fair 11.4% |
| Immigrants | Oceania | 39.5 /100 | #183 | Fair 11.4% |
| Kenyans | 39.2 /100 | #184 | Fair 11.4% |
| Danes | 36.8 /100 | #185 | Fair 11.4% |
| Slovenes | 36.6 /100 | #186 | Fair 11.4% |
| Immigrants | Bosnia and Herzegovina | 35.2 /100 | #187 | Fair 11.4% |
| Northern Europeans | 34.9 /100 | #188 | Fair 11.4% |
| Hungarians | 34.6 /100 | #189 | Fair 11.4% |
| Immigrants | Nigeria | 32.5 /100 | #190 | Fair 11.4% |