Immigrants from Grenada vs Ghanaian Disability Age Over 75
COMPARE
Immigrants from Grenada
Ghanaian
Disability Age Over 75
Disability Age Over 75 Comparison
Immigrants from Grenada
Ghanaians
47.9%
DISABILITY AGE OVER 75
9.4/ 100
METRIC RATING
217th/ 347
METRIC RANK
47.5%
DISABILITY AGE OVER 75
33.0/ 100
METRIC RATING
185th/ 347
METRIC RANK
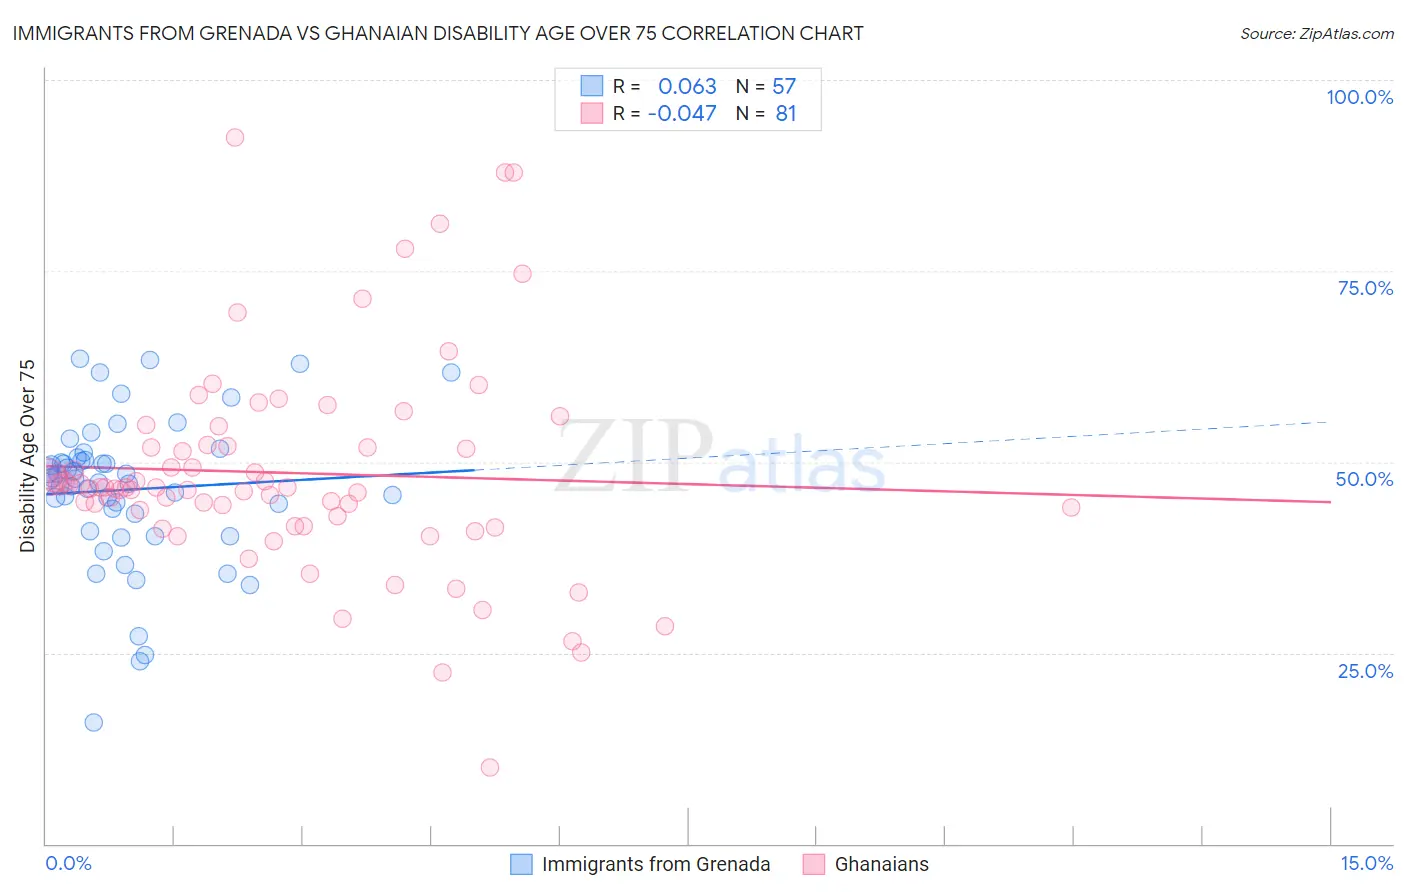
Immigrants from Grenada vs Ghanaian Disability Age Over 75 Correlation Chart
The statistical analysis conducted on geographies consisting of 67,162,084 people shows a slight positive correlation between the proportion of Immigrants from Grenada and percentage of population with a disability over the age of 75 in the United States with a correlation coefficient (R) of 0.063 and weighted average of 47.9%. Similarly, the statistical analysis conducted on geographies consisting of 190,232,806 people shows no correlation between the proportion of Ghanaians and percentage of population with a disability over the age of 75 in the United States with a correlation coefficient (R) of -0.047 and weighted average of 47.5%, a difference of 0.87%.
Disability Age Over 75 Correlation Summary
| Measurement | Immigrants from Grenada | Ghanaian |
| Minimum | 15.8% | 10.0% |
| Maximum | 63.4% | 92.5% |
| Range | 47.6% | 82.5% |
| Mean | 46.4% | 48.6% |
| Median | 47.7% | 46.6% |
| Interquartile 25% (IQ1) | 42.1% | 42.2% |
| Interquartile 75% (IQ3) | 50.4% | 52.1% |
| Interquartile Range (IQR) | 8.3% | 9.9% |
| Standard Deviation (Sample) | 9.6% | 14.0% |
| Standard Deviation (Population) | 9.6% | 14.0% |
Similar Demographics by Disability Age Over 75
Demographics Similar to Immigrants from Grenada by Disability Age Over 75
In terms of disability age over 75, the demographic groups most similar to Immigrants from Grenada are Immigrants from Panama (47.9%, a difference of 0.050%), Immigrants from Western Africa (48.0%, a difference of 0.070%), Immigrants from Barbados (47.9%, a difference of 0.080%), Senegalese (47.9%, a difference of 0.080%), and Laotian (47.9%, a difference of 0.12%).
| Demographics | Rating | Rank | Disability Age Over 75 |
| Vietnamese | 11.9 /100 | #210 | Poor 47.9% |
| Panamanians | 11.8 /100 | #211 | Poor 47.9% |
| Immigrants | Burma/Myanmar | 11.7 /100 | #212 | Poor 47.9% |
| Laotians | 11.5 /100 | #213 | Poor 47.9% |
| Immigrants | Barbados | 10.7 /100 | #214 | Poor 47.9% |
| Senegalese | 10.7 /100 | #215 | Poor 47.9% |
| Immigrants | Panama | 10.2 /100 | #216 | Poor 47.9% |
| Immigrants | Grenada | 9.4 /100 | #217 | Tragic 47.9% |
| Immigrants | Western Africa | 8.3 /100 | #218 | Tragic 48.0% |
| Immigrants | Western Asia | 7.5 /100 | #219 | Tragic 48.0% |
| Bahamians | 7.4 /100 | #220 | Tragic 48.0% |
| Immigrants | Oceania | 7.3 /100 | #221 | Tragic 48.0% |
| Barbadians | 6.8 /100 | #222 | Tragic 48.0% |
| Immigrants | Bangladesh | 6.8 /100 | #223 | Tragic 48.0% |
| Liberians | 6.7 /100 | #224 | Tragic 48.0% |
Demographics Similar to Ghanaians by Disability Age Over 75
In terms of disability age over 75, the demographic groups most similar to Ghanaians are Immigrants from Nigeria (47.5%, a difference of 0.030%), Sudanese (47.5%, a difference of 0.030%), Immigrants from Sudan (47.5%, a difference of 0.030%), Basque (47.6%, a difference of 0.060%), and Immigrants from Kenya (47.6%, a difference of 0.060%).
| Demographics | Rating | Rank | Disability Age Over 75 |
| Cubans | 42.1 /100 | #178 | Average 47.4% |
| Sierra Leoneans | 41.7 /100 | #179 | Average 47.4% |
| Immigrants | Ecuador | 41.7 /100 | #180 | Average 47.4% |
| Immigrants | Kazakhstan | 40.4 /100 | #181 | Average 47.4% |
| Immigrants | Moldova | 39.9 /100 | #182 | Fair 47.4% |
| Delaware | 39.1 /100 | #183 | Fair 47.5% |
| Immigrants | Nigeria | 34.0 /100 | #184 | Fair 47.5% |
| Ghanaians | 33.0 /100 | #185 | Fair 47.5% |
| Sudanese | 32.0 /100 | #186 | Fair 47.5% |
| Immigrants | Sudan | 31.8 /100 | #187 | Fair 47.5% |
| Basques | 30.9 /100 | #188 | Fair 47.6% |
| Immigrants | Kenya | 30.8 /100 | #189 | Fair 47.6% |
| Somalis | 29.5 /100 | #190 | Fair 47.6% |
| Portuguese | 29.3 /100 | #191 | Fair 47.6% |
| Immigrants | Jamaica | 28.3 /100 | #192 | Fair 47.6% |