Immigrants from Grenada vs Ghanaian Disability Age 18 to 34
COMPARE
Immigrants from Grenada
Ghanaian
Disability Age 18 to 34
Disability Age 18 to 34 Comparison
Immigrants from Grenada
Ghanaians
5.3%
DISABILITY AGE 18 TO 34
100.0/ 100
METRIC RATING
3rd/ 347
METRIC RANK
6.6%
DISABILITY AGE 18 TO 34
54.7/ 100
METRIC RATING
172nd/ 347
METRIC RANK
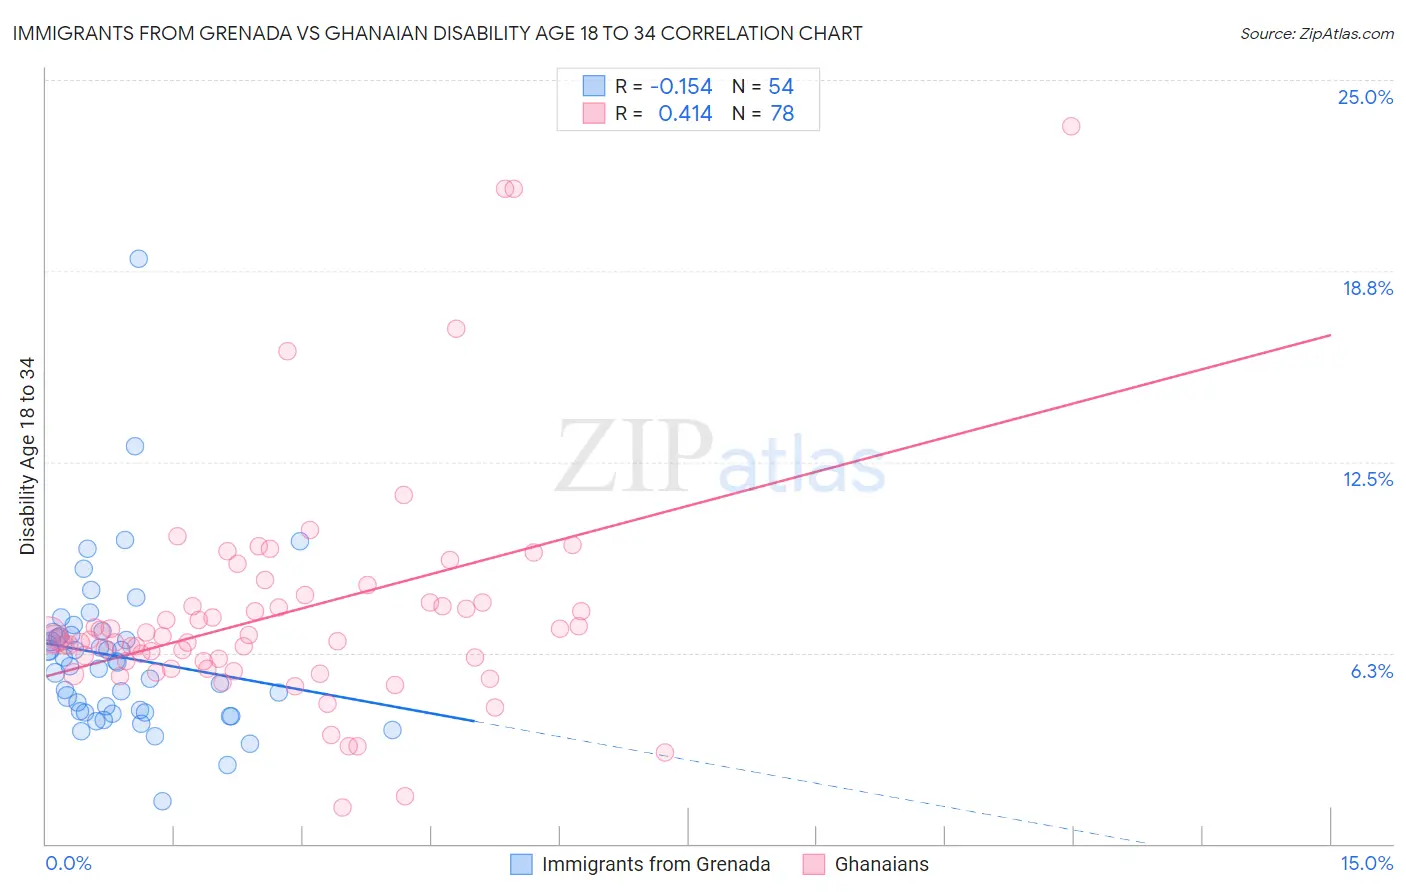
Immigrants from Grenada vs Ghanaian Disability Age 18 to 34 Correlation Chart
The statistical analysis conducted on geographies consisting of 67,171,054 people shows a poor negative correlation between the proportion of Immigrants from Grenada and percentage of population with a disability between the ages 18 and 35 in the United States with a correlation coefficient (R) of -0.154 and weighted average of 5.3%. Similarly, the statistical analysis conducted on geographies consisting of 190,614,383 people shows a moderate positive correlation between the proportion of Ghanaians and percentage of population with a disability between the ages 18 and 35 in the United States with a correlation coefficient (R) of 0.414 and weighted average of 6.6%, a difference of 23.4%.
Disability Age 18 to 34 Correlation Summary
| Measurement | Immigrants from Grenada | Ghanaian |
| Minimum | 1.4% | 1.2% |
| Maximum | 19.2% | 23.5% |
| Range | 17.8% | 22.3% |
| Mean | 6.1% | 7.6% |
| Median | 5.9% | 6.7% |
| Interquartile 25% (IQ1) | 4.3% | 6.0% |
| Interquartile 75% (IQ3) | 6.8% | 7.9% |
| Interquartile Range (IQR) | 2.5% | 1.9% |
| Standard Deviation (Sample) | 2.7% | 3.8% |
| Standard Deviation (Population) | 2.7% | 3.8% |
Similar Demographics by Disability Age 18 to 34
Demographics Similar to Immigrants from Grenada by Disability Age 18 to 34
In terms of disability age 18 to 34, the demographic groups most similar to Immigrants from Grenada are Immigrants from Cuba (5.4%, a difference of 0.65%), Immigrants from Taiwan (5.4%, a difference of 0.93%), Immigrants from Hong Kong (5.2%, a difference of 2.2%), Filipino (5.4%, a difference of 2.2%), and Immigrants from China (5.4%, a difference of 2.3%).
| Demographics | Rating | Rank | Disability Age 18 to 34 |
| Immigrants | Armenia | 100.0 /100 | #1 | Exceptional 5.0% |
| Immigrants | Hong Kong | 100.0 /100 | #2 | Exceptional 5.2% |
| Immigrants | Grenada | 100.0 /100 | #3 | Exceptional 5.3% |
| Immigrants | Cuba | 100.0 /100 | #4 | Exceptional 5.4% |
| Immigrants | Taiwan | 100.0 /100 | #5 | Exceptional 5.4% |
| Filipinos | 100.0 /100 | #6 | Exceptional 5.4% |
| Immigrants | China | 100.0 /100 | #7 | Exceptional 5.4% |
| Immigrants | Guyana | 100.0 /100 | #8 | Exceptional 5.5% |
| Guyanese | 100.0 /100 | #9 | Exceptional 5.5% |
| Immigrants | Uzbekistan | 100.0 /100 | #10 | Exceptional 5.5% |
| Vietnamese | 100.0 /100 | #11 | Exceptional 5.5% |
| Immigrants | St. Vincent and the Grenadines | 100.0 /100 | #12 | Exceptional 5.5% |
| Immigrants | Iran | 100.0 /100 | #13 | Exceptional 5.5% |
| Indians (Asian) | 100.0 /100 | #14 | Exceptional 5.5% |
| Immigrants | India | 100.0 /100 | #15 | Exceptional 5.6% |
Demographics Similar to Ghanaians by Disability Age 18 to 34
In terms of disability age 18 to 34, the demographic groups most similar to Ghanaians are Immigrants from Mexico (6.6%, a difference of 0.040%), Bahamian (6.6%, a difference of 0.050%), Immigrants from Bahamas (6.6%, a difference of 0.22%), Native Hawaiian (6.6%, a difference of 0.33%), and Russian (6.5%, a difference of 0.39%).
| Demographics | Rating | Rank | Disability Age 18 to 34 |
| Immigrants | Hungary | 69.6 /100 | #165 | Good 6.5% |
| Eastern Europeans | 65.1 /100 | #166 | Good 6.5% |
| Immigrants | Northern Europe | 64.1 /100 | #167 | Good 6.5% |
| Immigrants | Moldova | 63.1 /100 | #168 | Good 6.5% |
| Russians | 60.2 /100 | #169 | Good 6.5% |
| Immigrants | Bahamas | 57.9 /100 | #170 | Average 6.6% |
| Bahamians | 55.5 /100 | #171 | Average 6.6% |
| Ghanaians | 54.7 /100 | #172 | Average 6.6% |
| Immigrants | Mexico | 54.1 /100 | #173 | Average 6.6% |
| Native Hawaiians | 50.0 /100 | #174 | Average 6.6% |
| Immigrants | Cambodia | 46.5 /100 | #175 | Average 6.6% |
| Immigrants | Africa | 45.9 /100 | #176 | Average 6.6% |
| Syrians | 44.3 /100 | #177 | Average 6.6% |
| Nigerians | 43.7 /100 | #178 | Average 6.6% |
| Immigrants | Ghana | 42.1 /100 | #179 | Average 6.6% |