Immigrants from Sudan vs Ghanaian Disability Age Over 75
COMPARE
Immigrants from Sudan
Ghanaian
Disability Age Over 75
Disability Age Over 75 Comparison
Immigrants from Sudan
Ghanaians
47.5%
DISABILITY AGE OVER 75
31.8/ 100
METRIC RATING
187th/ 347
METRIC RANK
47.5%
DISABILITY AGE OVER 75
33.0/ 100
METRIC RATING
185th/ 347
METRIC RANK
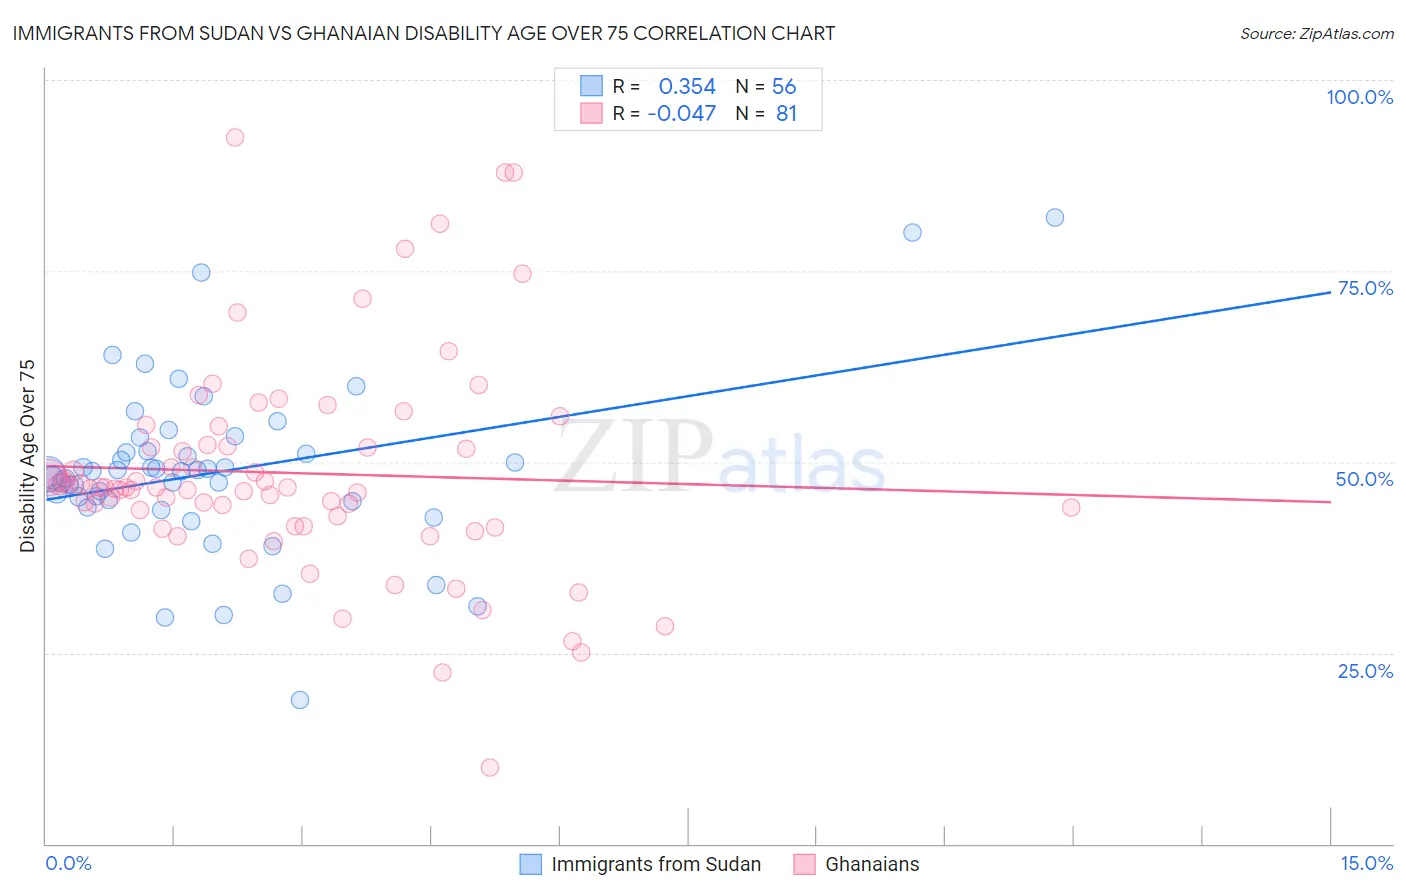
Immigrants from Sudan vs Ghanaian Disability Age Over 75 Correlation Chart
The statistical analysis conducted on geographies consisting of 118,950,440 people shows a mild positive correlation between the proportion of Immigrants from Sudan and percentage of population with a disability over the age of 75 in the United States with a correlation coefficient (R) of 0.354 and weighted average of 47.5%. Similarly, the statistical analysis conducted on geographies consisting of 190,232,806 people shows no correlation between the proportion of Ghanaians and percentage of population with a disability over the age of 75 in the United States with a correlation coefficient (R) of -0.047 and weighted average of 47.5%, a difference of 0.030%.
Disability Age Over 75 Correlation Summary
| Measurement | Immigrants from Sudan | Ghanaian |
| Minimum | 18.9% | 10.0% |
| Maximum | 82.1% | 92.5% |
| Range | 63.2% | 82.5% |
| Mean | 48.6% | 48.6% |
| Median | 48.6% | 46.6% |
| Interquartile 25% (IQ1) | 44.4% | 42.2% |
| Interquartile 75% (IQ3) | 51.3% | 52.1% |
| Interquartile Range (IQR) | 6.8% | 9.9% |
| Standard Deviation (Sample) | 11.1% | 14.0% |
| Standard Deviation (Population) | 11.0% | 14.0% |
Demographics Similar to Immigrants from Sudan and Ghanaians by Disability Age Over 75
In terms of disability age over 75, the demographic groups most similar to Immigrants from Sudan are Sudanese (47.5%, a difference of 0.010%), Basque (47.6%, a difference of 0.020%), Immigrants from Kenya (47.6%, a difference of 0.020%), Immigrants from Nigeria (47.5%, a difference of 0.060%), and Somali (47.6%, a difference of 0.060%). Similarly, the demographic groups most similar to Ghanaians are Immigrants from Nigeria (47.5%, a difference of 0.030%), Sudanese (47.5%, a difference of 0.030%), Basque (47.6%, a difference of 0.060%), Immigrants from Kenya (47.6%, a difference of 0.060%), and Somali (47.6%, a difference of 0.090%).
| Demographics | Rating | Rank | Disability Age Over 75 |
| Ecuadorians | 46.7 /100 | #176 | Average 47.4% |
| Haitians | 44.6 /100 | #177 | Average 47.4% |
| Cubans | 42.1 /100 | #178 | Average 47.4% |
| Sierra Leoneans | 41.7 /100 | #179 | Average 47.4% |
| Immigrants | Ecuador | 41.7 /100 | #180 | Average 47.4% |
| Immigrants | Kazakhstan | 40.4 /100 | #181 | Average 47.4% |
| Immigrants | Moldova | 39.9 /100 | #182 | Fair 47.4% |
| Delaware | 39.1 /100 | #183 | Fair 47.5% |
| Immigrants | Nigeria | 34.0 /100 | #184 | Fair 47.5% |
| Ghanaians | 33.0 /100 | #185 | Fair 47.5% |
| Sudanese | 32.0 /100 | #186 | Fair 47.5% |
| Immigrants | Sudan | 31.8 /100 | #187 | Fair 47.5% |
| Basques | 30.9 /100 | #188 | Fair 47.6% |
| Immigrants | Kenya | 30.8 /100 | #189 | Fair 47.6% |
| Somalis | 29.5 /100 | #190 | Fair 47.6% |
| Portuguese | 29.3 /100 | #191 | Fair 47.6% |
| Immigrants | Jamaica | 28.3 /100 | #192 | Fair 47.6% |
| Ottawa | 28.1 /100 | #193 | Fair 47.6% |
| Immigrants | Lebanon | 26.5 /100 | #194 | Fair 47.6% |
| Immigrants | Trinidad and Tobago | 25.3 /100 | #195 | Fair 47.6% |
| Immigrants | Portugal | 23.8 /100 | #196 | Fair 47.6% |