Dutch vs Immigrants from Scotland Disability Age Over 75
COMPARE
Dutch
Immigrants from Scotland
Disability Age Over 75
Disability Age Over 75 Comparison
Dutch
Immigrants from Scotland
46.5%
DISABILITY AGE OVER 75
95.9/ 100
METRIC RATING
114th/ 347
METRIC RANK
45.1%
DISABILITY AGE OVER 75
100.0/ 100
METRIC RATING
14th/ 347
METRIC RANK
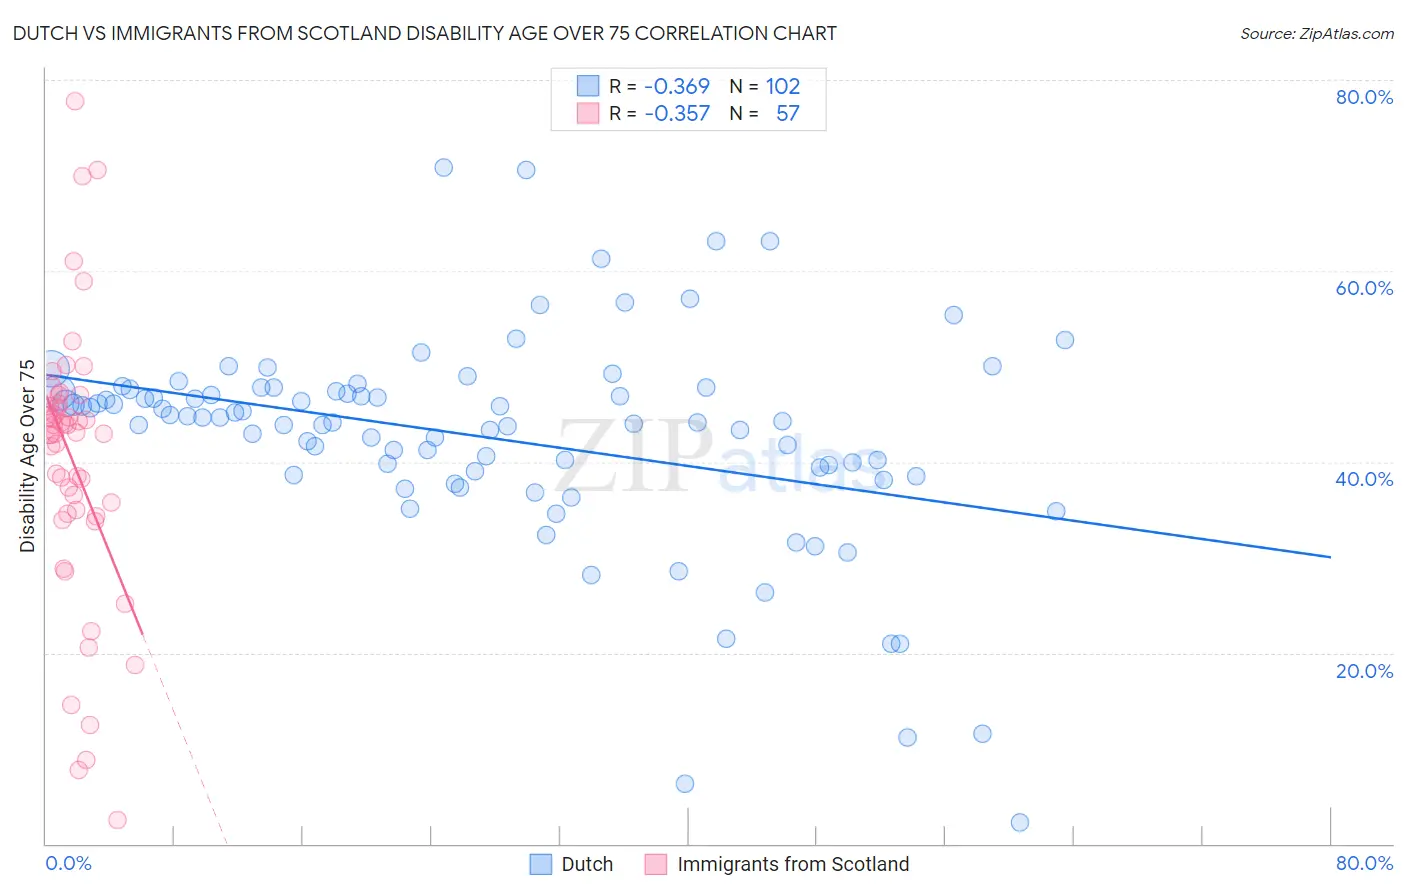
Dutch vs Immigrants from Scotland Disability Age Over 75 Correlation Chart
The statistical analysis conducted on geographies consisting of 552,623,660 people shows a mild negative correlation between the proportion of Dutch and percentage of population with a disability over the age of 75 in the United States with a correlation coefficient (R) of -0.369 and weighted average of 46.5%. Similarly, the statistical analysis conducted on geographies consisting of 196,341,463 people shows a mild negative correlation between the proportion of Immigrants from Scotland and percentage of population with a disability over the age of 75 in the United States with a correlation coefficient (R) of -0.357 and weighted average of 45.1%, a difference of 3.1%.
Disability Age Over 75 Correlation Summary
| Measurement | Dutch | Immigrants from Scotland |
| Minimum | 2.2% | 2.5% |
| Maximum | 70.9% | 77.8% |
| Range | 68.6% | 75.3% |
| Mean | 42.6% | 40.0% |
| Median | 44.5% | 42.9% |
| Interquartile 25% (IQ1) | 39.0% | 34.5% |
| Interquartile 75% (IQ3) | 47.3% | 46.0% |
| Interquartile Range (IQR) | 8.4% | 11.5% |
| Standard Deviation (Sample) | 11.2% | 14.5% |
| Standard Deviation (Population) | 11.1% | 14.4% |
Similar Demographics by Disability Age Over 75
Demographics Similar to Dutch by Disability Age Over 75
In terms of disability age over 75, the demographic groups most similar to Dutch are Irish (46.5%, a difference of 0.010%), British (46.5%, a difference of 0.020%), Immigrants from Pakistan (46.5%, a difference of 0.030%), Indian (Asian) (46.5%, a difference of 0.030%), and Immigrants from Hong Kong (46.5%, a difference of 0.070%).
| Demographics | Rating | Rank | Disability Age Over 75 |
| Immigrants | Uruguay | 96.7 /100 | #107 | Exceptional 46.4% |
| Brazilians | 96.6 /100 | #108 | Exceptional 46.5% |
| Chileans | 96.4 /100 | #109 | Exceptional 46.5% |
| Immigrants | Hong Kong | 96.4 /100 | #110 | Exceptional 46.5% |
| Immigrants | Chile | 96.4 /100 | #111 | Exceptional 46.5% |
| Immigrants | Pakistan | 96.1 /100 | #112 | Exceptional 46.5% |
| Irish | 96.0 /100 | #113 | Exceptional 46.5% |
| Dutch | 95.9 /100 | #114 | Exceptional 46.5% |
| British | 95.7 /100 | #115 | Exceptional 46.5% |
| Indians (Asian) | 95.7 /100 | #116 | Exceptional 46.5% |
| Hungarians | 95.3 /100 | #117 | Exceptional 46.5% |
| Czechoslovakians | 94.7 /100 | #118 | Exceptional 46.6% |
| Canadians | 94.4 /100 | #119 | Exceptional 46.6% |
| Immigrants | Nepal | 94.1 /100 | #120 | Exceptional 46.6% |
| Scandinavians | 93.6 /100 | #121 | Exceptional 46.6% |
Demographics Similar to Immigrants from Scotland by Disability Age Over 75
In terms of disability age over 75, the demographic groups most similar to Immigrants from Scotland are Latvian (45.1%, a difference of 0.010%), Immigrants from Czechoslovakia (45.1%, a difference of 0.020%), Immigrants from Sweden (45.1%, a difference of 0.040%), Lithuanian (45.1%, a difference of 0.12%), and Immigrants from Northern Europe (45.2%, a difference of 0.14%).
| Demographics | Rating | Rank | Disability Age Over 75 |
| Okinawans | 100.0 /100 | #7 | Exceptional 44.9% |
| Immigrants | Austria | 100.0 /100 | #8 | Exceptional 44.9% |
| Paraguayans | 100.0 /100 | #9 | Exceptional 45.0% |
| Bulgarians | 100.0 /100 | #10 | Exceptional 45.1% |
| Lithuanians | 100.0 /100 | #11 | Exceptional 45.1% |
| Immigrants | Czechoslovakia | 100.0 /100 | #12 | Exceptional 45.1% |
| Latvians | 100.0 /100 | #13 | Exceptional 45.1% |
| Immigrants | Scotland | 100.0 /100 | #14 | Exceptional 45.1% |
| Immigrants | Sweden | 100.0 /100 | #15 | Exceptional 45.1% |
| Immigrants | Northern Europe | 100.0 /100 | #16 | Exceptional 45.2% |
| Immigrants | India | 100.0 /100 | #17 | Exceptional 45.2% |
| Bolivians | 100.0 /100 | #18 | Exceptional 45.2% |
| Immigrants | Greece | 100.0 /100 | #19 | Exceptional 45.2% |
| Immigrants | Serbia | 100.0 /100 | #20 | Exceptional 45.3% |
| Immigrants | Belgium | 100.0 /100 | #21 | Exceptional 45.3% |