Immigrants from Ethiopia vs Immigrants from Costa Rica Disability Age 65 to 74
COMPARE
Immigrants from Ethiopia
Immigrants from Costa Rica
Disability Age 65 to 74
Disability Age 65 to 74 Comparison
Immigrants from Ethiopia
Immigrants from Costa Rica
22.7%
DISABILITY AGE 65 TO 74
85.3/ 100
METRIC RATING
142nd/ 347
METRIC RANK
22.6%
DISABILITY AGE 65 TO 74
90.4/ 100
METRIC RATING
128th/ 347
METRIC RANK
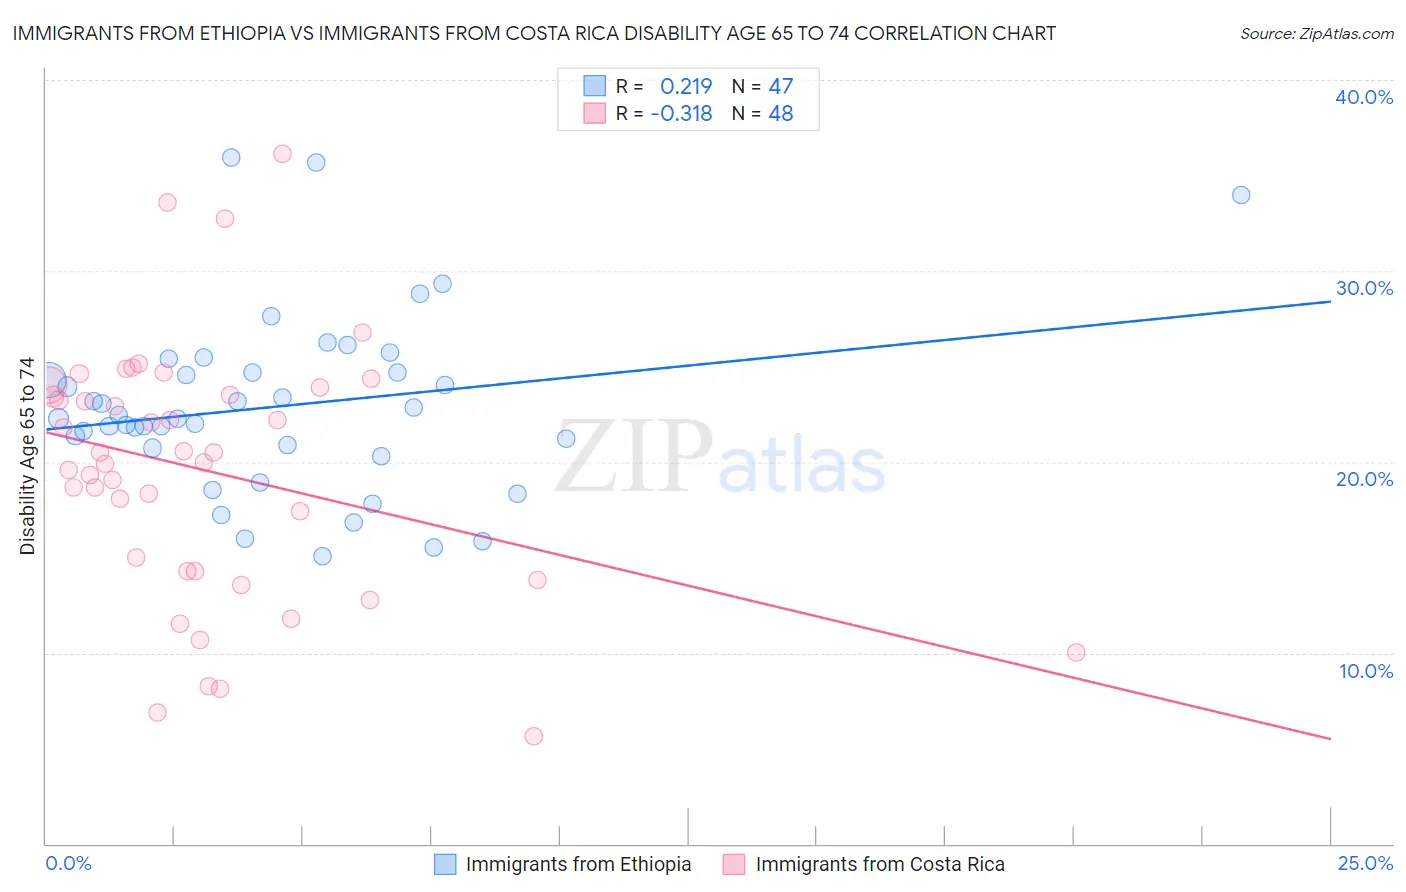
Immigrants from Ethiopia vs Immigrants from Costa Rica Disability Age 65 to 74 Correlation Chart
The statistical analysis conducted on geographies consisting of 211,341,369 people shows a weak positive correlation between the proportion of Immigrants from Ethiopia and percentage of population with a disability between the ages 65 and 75 in the United States with a correlation coefficient (R) of 0.219 and weighted average of 22.7%. Similarly, the statistical analysis conducted on geographies consisting of 204,181,573 people shows a mild negative correlation between the proportion of Immigrants from Costa Rica and percentage of population with a disability between the ages 65 and 75 in the United States with a correlation coefficient (R) of -0.318 and weighted average of 22.6%, a difference of 0.73%.
Disability Age 65 to 74 Correlation Summary
| Measurement | Immigrants from Ethiopia | Immigrants from Costa Rica |
| Minimum | 15.1% | 5.6% |
| Maximum | 35.9% | 36.1% |
| Range | 20.9% | 30.5% |
| Mean | 22.9% | 19.5% |
| Median | 22.3% | 20.2% |
| Interquartile 25% (IQ1) | 20.7% | 14.3% |
| Interquartile 75% (IQ3) | 24.7% | 23.7% |
| Interquartile Range (IQR) | 4.0% | 9.4% |
| Standard Deviation (Sample) | 4.7% | 6.7% |
| Standard Deviation (Population) | 4.6% | 6.6% |
Demographics Similar to Immigrants from Ethiopia and Immigrants from Costa Rica by Disability Age 65 to 74
In terms of disability age 65 to 74, the demographic groups most similar to Immigrants from Ethiopia are Belgian (22.7%, a difference of 0.010%), Ugandan (22.7%, a difference of 0.020%), Immigrants from Syria (22.7%, a difference of 0.060%), Arab (22.8%, a difference of 0.060%), and Danish (22.8%, a difference of 0.11%). Similarly, the demographic groups most similar to Immigrants from Costa Rica are Immigrants from Uruguay (22.6%, a difference of 0.060%), Immigrants from Albania (22.6%, a difference of 0.070%), Immigrants from Nepal (22.6%, a difference of 0.16%), Costa Rican (22.6%, a difference of 0.19%), and Slovak (22.5%, a difference of 0.23%).
| Demographics | Rating | Rank | Disability Age 65 to 74 |
| Immigrants | Western Europe | 92.3 /100 | #125 | Exceptional 22.5% |
| Lebanese | 92.2 /100 | #126 | Exceptional 22.5% |
| Slovaks | 91.6 /100 | #127 | Exceptional 22.5% |
| Immigrants | Costa Rica | 90.4 /100 | #128 | Exceptional 22.6% |
| Immigrants | Uruguay | 90.1 /100 | #129 | Exceptional 22.6% |
| Immigrants | Albania | 90.0 /100 | #130 | Excellent 22.6% |
| Immigrants | Nepal | 89.4 /100 | #131 | Excellent 22.6% |
| Costa Ricans | 89.2 /100 | #132 | Excellent 22.6% |
| Northern Europeans | 88.9 /100 | #133 | Excellent 22.6% |
| Afghans | 88.6 /100 | #134 | Excellent 22.6% |
| Immigrants | Ukraine | 88.4 /100 | #135 | Excellent 22.6% |
| Ethiopians | 87.9 /100 | #136 | Excellent 22.7% |
| Taiwanese | 87.6 /100 | #137 | Excellent 22.7% |
| Immigrants | Moldova | 87.3 /100 | #138 | Excellent 22.7% |
| Immigrants | Syria | 85.8 /100 | #139 | Excellent 22.7% |
| Ugandans | 85.4 /100 | #140 | Excellent 22.7% |
| Belgians | 85.3 /100 | #141 | Excellent 22.7% |
| Immigrants | Ethiopia | 85.3 /100 | #142 | Excellent 22.7% |
| Arabs | 84.8 /100 | #143 | Excellent 22.8% |
| Danes | 84.4 /100 | #144 | Excellent 22.8% |
| Immigrants | Uganda | 84.0 /100 | #145 | Excellent 22.8% |