Immigrants from Egypt vs Immigrants from Costa Rica Disability Age 65 to 74

COMPARE

Immigrants from Egypt
Race
Ancestry
AfghanAfricanAlaska NativeAlaskan AthabascanAlbanianAleutAlsatianAmericanApacheArabArapahoArgentineanArmenianAssyrian/Chaldean/SyriacAustralianAustrianBahamianBangladeshiBarbadianBasqueBelgianBelizeanBermudanBhutaneseBlackfeetBolivianBrazilianBritishBritish West IndianBulgarianBurmeseCajunCambodianCanadianCape VerdeanCarpatho RusynCelticCentral AmericanCentral American IndianCherokeeCheyenneChickasawChileanChineseChippewaChoctawColombianColvilleComancheCosta RicanCreeCreekCroatianCrowCubanCypriotCzechCzechoslovakianDanishDelawareDominicanDutchDutch West IndianEastern EuropeanEcuadorianEgyptianEnglishEstonianEthiopianEuropeanFijianFilipinoFinnishFrenchFrench American IndianFrench CanadianGermanGerman RussianGhanaianGreekGuamanian/ChamorroGuatemalanGuyaneseHaitianHmongHonduranHopiHoumaHungarianIcelanderIndian (Asian)IndonesianInupiatIranianIraqiIrishIroquoisIsraeliItalianJamaicanJapaneseJordanianKenyanKiowaKoreanLaotianLatvianLebaneseLiberianLithuanianLumbeeLuxembourgerMacedonianMalaysianMalteseMarshalleseMenomineeMexicanMexican American IndianMongolianMoroccanNative HawaiianNavajoNepaleseNew ZealanderNicaraguanNigerianNorthern EuropeanNorwegianOkinawanOsageOttawaPaiutePakistaniPalestinianPanamanianParaguayanPennsylvania GermanPeruvianPimaPolishPortuguesePotawatomiPuebloPuerto RicanPuget Sound SalishRomanianRussianSalvadoranSamoanScandinavianScotch-IrishScottishSeminoleSenegaleseSerbianShoshoneSierra LeoneanSiouxSlavicSlovakSloveneSomaliSouth AfricanSouth AmericanSouth American IndianSoviet UnionSpaniardSpanishSpanish AmericanSpanish American IndianSri LankanSubsaharan AfricanSudaneseSwedishSwissSyrianTaiwaneseThaiTlingit-HaidaTohono O'OdhamTonganTrinidadian and TobagonianTsimshianTurkishU.S. Virgin IslanderUgandanUkrainianUruguayanUteVenezuelanVietnameseWelshWest IndianYakamaYaquiYugoslavianYumanYup'ikZimbabwean
Immigration
NonimmigrantsImmigrantsAfghanistanAfricaAlbaniaArgentinaArmeniaAsiaAustraliaAustriaBahamasBangladeshBarbadosBelarusBelgiumBelizeBoliviaBosnia and HerzegovinaBrazilBulgariaBurma/MyanmarCabo VerdeCambodiaCameroonCanadaCaribbeanCentral AmericaChileChinaColombiaCongoCroatiaCubaCzechoslovakiaDenmarkDominicaDominican RepublicEastern AfricaEastern AsiaEastern EuropeEcuadorEgyptEl SalvadorEnglandEritreaEthiopiaEuropeFijiFranceGermanyGhanaGreeceGrenadaGuatemalaGuyanaHaitiHondurasHong KongHungaryIndiaIndonesiaIranIraqIrelandIsraelItalyJamaicaJapanJordanKazakhstanKenyaKoreaKuwaitLaosLatin AmericaLatviaLebanonLiberiaLithuaniaMalaysiaMexicoMicronesiaMiddle AfricaMoldovaMoroccoNepalNetherlandsNicaraguaNigeriaNorth AmericaNorth MacedoniaNorthern AfricaNorthern EuropeNorwayOceaniaPakistanPanamaPeruPhilippinesPolandPortugalRomaniaRussiaSaudi ArabiaScotlandSenegalSerbiaSierra LeoneSingaporeSomaliaSouth AfricaSouth AmericaSouth Central AsiaSouth Eastern AsiaSouthern EuropeSpainSri LankaSt. Vincent and the GrenadinesSudanSwedenSwitzerlandSyriaTaiwanThailandTrinidad and TobagoTurkeyUgandaUkraineUruguayUzbekistanVenezuelaVietnamWest IndiesWestern AfricaWestern AsiaWestern EuropeYemenZaireZimbabweAzores
Immigrants from Costa Rica
Race
Ancestry
AfghanAfricanAlaska NativeAlaskan AthabascanAlbanianAleutAlsatianAmericanApacheArabArapahoArgentineanArmenianAssyrian/Chaldean/SyriacAustralianAustrianBahamianBangladeshiBarbadianBasqueBelgianBelizeanBermudanBhutaneseBlackfeetBolivianBrazilianBritishBritish West IndianBulgarianBurmeseCajunCambodianCanadianCape VerdeanCarpatho RusynCelticCentral AmericanCentral American IndianCherokeeCheyenneChickasawChileanChineseChippewaChoctawColombianColvilleComancheCosta RicanCreeCreekCroatianCrowCubanCypriotCzechCzechoslovakianDanishDelawareDominicanDutchDutch West IndianEastern EuropeanEcuadorianEgyptianEnglishEstonianEthiopianEuropeanFijianFilipinoFinnishFrenchFrench American IndianFrench CanadianGermanGerman RussianGhanaianGreekGuamanian/ChamorroGuatemalanGuyaneseHaitianHmongHonduranHopiHoumaHungarianIcelanderIndian (Asian)IndonesianInupiatIranianIraqiIrishIroquoisIsraeliItalianJamaicanJapaneseJordanianKenyanKiowaKoreanLaotianLatvianLebaneseLiberianLithuanianLumbeeLuxembourgerMacedonianMalaysianMalteseMarshalleseMenomineeMexicanMexican American IndianMongolianMoroccanNative HawaiianNavajoNepaleseNew ZealanderNicaraguanNigerianNorthern EuropeanNorwegianOkinawanOsageOttawaPaiutePakistaniPalestinianPanamanianParaguayanPennsylvania GermanPeruvianPimaPolishPortuguesePotawatomiPuebloPuerto RicanPuget Sound SalishRomanianRussianSalvadoranSamoanScandinavianScotch-IrishScottishSeminoleSenegaleseSerbianShoshoneSierra LeoneanSiouxSlavicSlovakSloveneSomaliSouth AfricanSouth AmericanSouth American IndianSoviet UnionSpaniardSpanishSpanish AmericanSpanish American IndianSri LankanSubsaharan AfricanSudaneseSwedishSwissSyrianTaiwaneseThaiTlingit-HaidaTohono O'OdhamTonganTrinidadian and TobagonianTsimshianTurkishU.S. Virgin IslanderUgandanUkrainianUruguayanUteVenezuelanVietnameseWelshWest IndianYakamaYaquiYugoslavianYumanYup'ikZimbabwean
Immigration
NonimmigrantsImmigrantsAfghanistanAfricaAlbaniaArgentinaArmeniaAsiaAustraliaAustriaBahamasBangladeshBarbadosBelarusBelgiumBelizeBoliviaBosnia and HerzegovinaBrazilBulgariaBurma/MyanmarCabo VerdeCambodiaCameroonCanadaCaribbeanCentral AmericaChileChinaColombiaCongoCosta RicaCroatiaCubaCzechoslovakiaDenmarkDominicaDominican RepublicEastern AfricaEastern AsiaEastern EuropeEcuadorEl SalvadorEnglandEritreaEthiopiaEuropeFijiFranceGermanyGhanaGreeceGrenadaGuatemalaGuyanaHaitiHondurasHong KongHungaryIndiaIndonesiaIranIraqIrelandIsraelItalyJamaicaJapanJordanKazakhstanKenyaKoreaKuwaitLaosLatin AmericaLatviaLebanonLiberiaLithuaniaMalaysiaMexicoMicronesiaMiddle AfricaMoldovaMoroccoNepalNetherlandsNicaraguaNigeriaNorth AmericaNorth MacedoniaNorthern AfricaNorthern EuropeNorwayOceaniaPakistanPanamaPeruPhilippinesPolandPortugalRomaniaRussiaSaudi ArabiaScotlandSenegalSerbiaSierra LeoneSingaporeSomaliaSouth AfricaSouth AmericaSouth Central AsiaSouth Eastern AsiaSouthern EuropeSpainSri LankaSt. Vincent and the GrenadinesSudanSwedenSwitzerlandSyriaTaiwanThailandTrinidad and TobagoTurkeyUgandaUkraineUruguayUzbekistanVenezuelaVietnamWest IndiesWestern AfricaWestern AsiaWestern EuropeYemenZaireZimbabweAzores
Disability Age 65 to 74
Income
Poverty
Unemployment
Labor Participation
Family Structure
Vehicle Availability
Education Level
Disability

Disability Age 65 to 74 Comparison

Immigrants from Egypt

Immigrants from Costa Rica

Exceptional
Exceptional
21.7%
DISABILITY AGE 65 TO 74
99.2/ 100
METRIC RATING
69th/ 347
METRIC RANK
22.6%
DISABILITY AGE 65 TO 74
90.4/ 100
METRIC RATING
128th/ 347
METRIC RANK

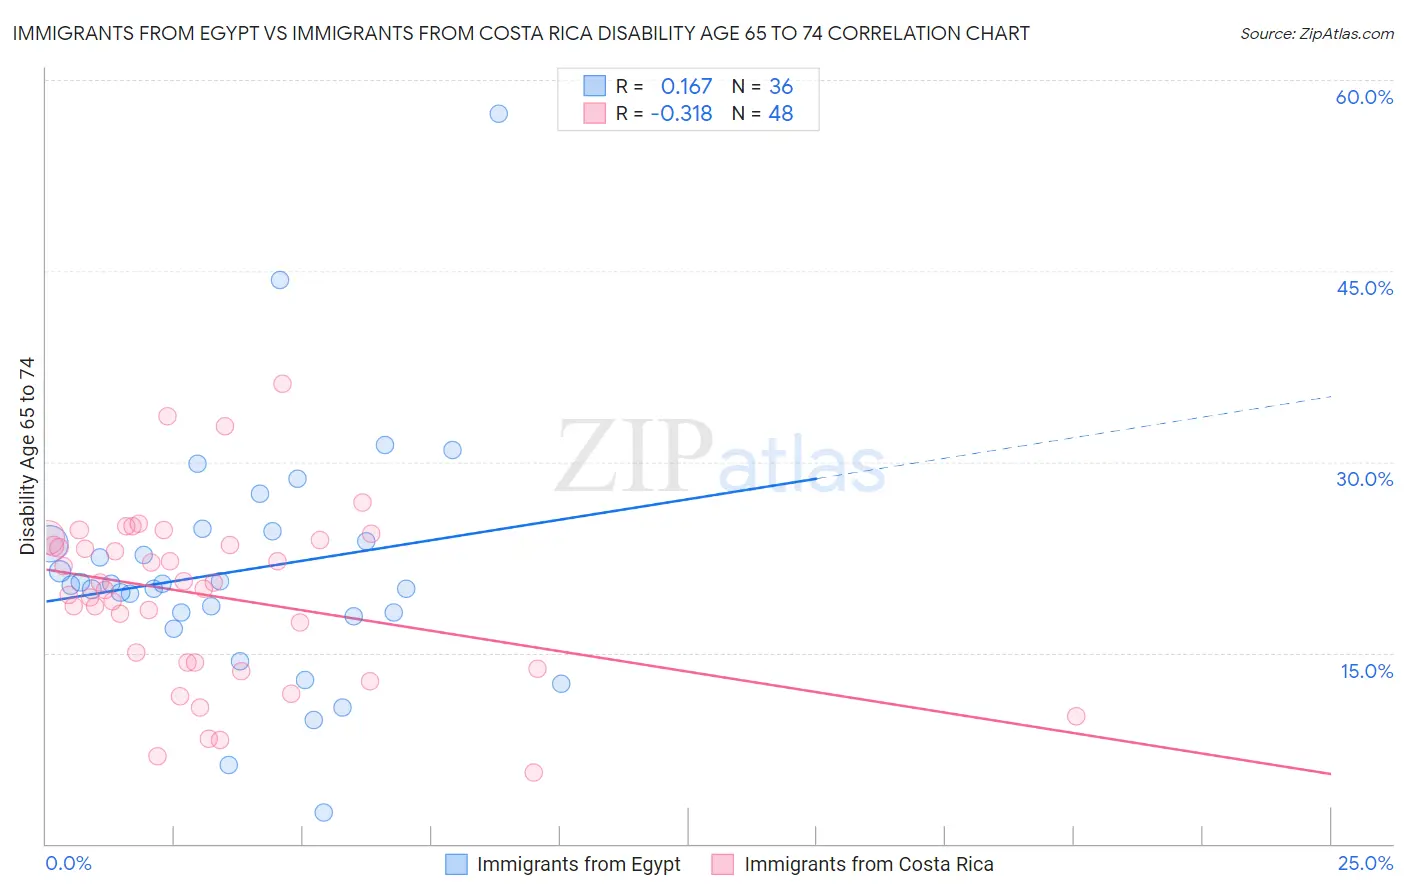
Immigrants from Egypt vs Immigrants from Costa Rica Disability Age 65 to 74 Correlation Chart

The statistical analysis conducted on geographies consisting of 245,305,558 people shows a poor positive correlation between the proportion of Immigrants from Egypt and percentage of population with a disability between the ages 65 and 75 in the United States with a correlation coefficient (R) of 0.167 and weighted average of 21.7%. Similarly, the statistical analysis conducted on geographies consisting of 204,181,573 people shows a mild negative correlation between the proportion of Immigrants from Costa Rica and percentage of population with a disability between the ages 65 and 75 in the United States with a correlation coefficient (R) of -0.318 and weighted average of 22.6%, a difference of 4.0%.
Immigrants from Egypt vs Immigrants from Costa Rica Disability Age 65 to 74

Disability Age 65 to 74 Correlation Summary

MeasurementImmigrants from EgyptImmigrants from Costa Rica
Minimum2.4%5.6%
Maximum57.3%36.1%
Range54.9%30.5%
Mean21.5%19.5%
Median20.4%20.2%
Interquartile 25% (IQ1)18.0%14.3%
Interquartile 75% (IQ3)24.2%23.7%
Interquartile Range (IQR)6.2%9.4%
Standard Deviation (Sample)9.7%6.7%
Standard Deviation (Population)9.6%6.6%

Similar Demographics by Disability Age 65 to 74

Demographics Similar to Immigrants from Egypt by Disability Age 65 to 74

In terms of disability age 65 to 74, the demographic groups most similar to Immigrants from Egypt are Chinese (21.7%, a difference of 0.0%), Immigrants from Belarus (21.7%, a difference of 0.060%), Immigrants from Hungary (21.7%, a difference of 0.070%), Immigrants from Scotland (21.7%, a difference of 0.13%), and Immigrants from South Africa (21.7%, a difference of 0.22%).
DemographicsRating | RankDisability Age 65 to 74
Carpatho Rusyns
99.5
/100
|
#62
Exceptional
21.6%
Immigrants | Europe
99.4
/100
|
#63
Exceptional
21.6%
Immigrants | Latvia
99.4
/100
|
#64
Exceptional
21.6%
Immigrants | Russia
99.4
/100
|
#65
Exceptional
21.6%
Maltese
99.4
/100
|
#66
Exceptional
21.6%
Immigrants | South Africa
99.3
/100
|
#67
Exceptional
21.7%
Immigrants | Scotland
99.3
/100
|
#68
Exceptional
21.7%
Immigrants | Egypt
99.2
/100
|
#69
Exceptional
21.7%
Chinese
99.2
/100
|
#70
Exceptional
21.7%
Immigrants | Belarus
99.2
/100
|
#71
Exceptional
21.7%
Immigrants | Hungary
99.2
/100
|
#72
Exceptional
21.7%
Immigrants | Venezuela
99.0
/100
|
#73
Exceptional
21.8%
Cambodians
99.0
/100
|
#74
Exceptional
21.8%
Mongolians
99.0
/100
|
#75
Exceptional
21.8%
Greeks
99.0
/100
|
#76
Exceptional
21.8%

Demographics Similar to Immigrants from Costa Rica by Disability Age 65 to 74

In terms of disability age 65 to 74, the demographic groups most similar to Immigrants from Costa Rica are Immigrants from Uruguay (22.6%, a difference of 0.060%), Immigrants from Albania (22.6%, a difference of 0.070%), Immigrants from Nepal (22.6%, a difference of 0.16%), Costa Rican (22.6%, a difference of 0.19%), and Slovak (22.5%, a difference of 0.23%).
DemographicsRating | RankDisability Age 65 to 74
Czechs
93.5
/100
|
#121
Exceptional
22.4%
Immigrants | Jordan
93.5
/100
|
#122
Exceptional
22.4%
Hungarians
93.3
/100
|
#123
Exceptional
22.4%
Norwegians
92.5
/100
|
#124
Exceptional
22.5%
Immigrants | Western Europe
92.3
/100
|
#125
Exceptional
22.5%
Lebanese
92.2
/100
|
#126
Exceptional
22.5%
Slovaks
91.6
/100
|
#127
Exceptional
22.5%
Immigrants | Costa Rica
90.4
/100
|
#128
Exceptional
22.6%
Immigrants | Uruguay
90.1
/100
|
#129
Exceptional
22.6%
Immigrants | Albania
90.0
/100
|
#130
Excellent
22.6%
Immigrants | Nepal
89.4
/100
|
#131
Excellent
22.6%
Costa Ricans
89.2
/100
|
#132
Excellent
22.6%
Northern Europeans
88.9
/100
|
#133
Excellent
22.6%
Afghans
88.6
/100
|
#134
Excellent
22.6%
Immigrants | Ukraine
88.4
/100
|
#135
Excellent
22.6%