Immigrants from Egypt vs Immigrants from Switzerland Disability Age 65 to 74
COMPARE
Immigrants from Egypt
Immigrants from Switzerland
Disability Age 65 to 74
Disability Age 65 to 74 Comparison
Immigrants from Egypt
Immigrants from Switzerland
21.7%
DISABILITY AGE 65 TO 74
99.2/ 100
METRIC RATING
69th/ 347
METRIC RANK
21.1%
DISABILITY AGE 65 TO 74
99.8/ 100
METRIC RATING
36th/ 347
METRIC RANK
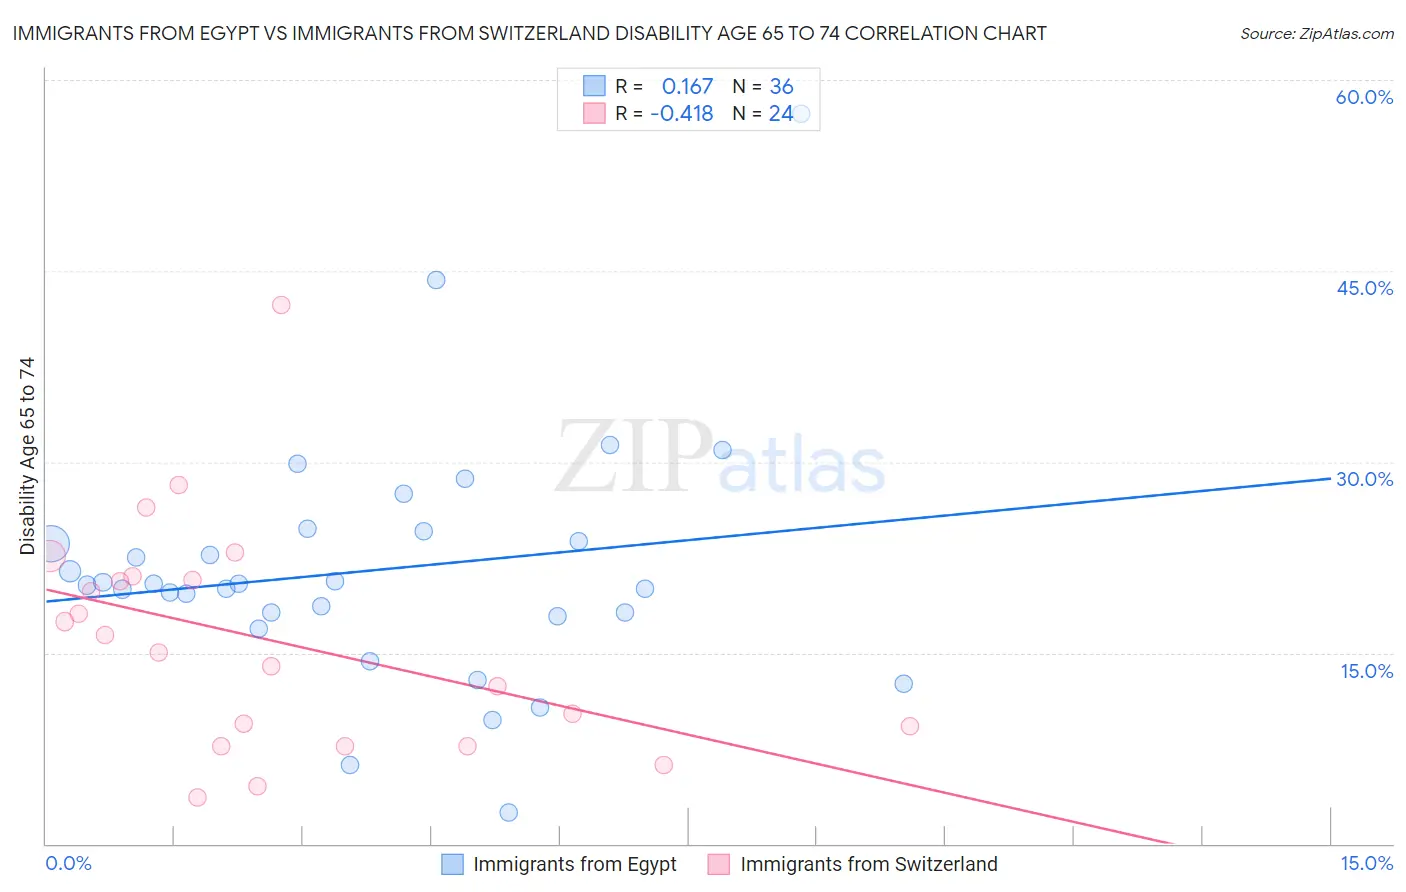
Immigrants from Egypt vs Immigrants from Switzerland Disability Age 65 to 74 Correlation Chart
The statistical analysis conducted on geographies consisting of 245,305,558 people shows a poor positive correlation between the proportion of Immigrants from Egypt and percentage of population with a disability between the ages 65 and 75 in the United States with a correlation coefficient (R) of 0.167 and weighted average of 21.7%. Similarly, the statistical analysis conducted on geographies consisting of 147,992,813 people shows a moderate negative correlation between the proportion of Immigrants from Switzerland and percentage of population with a disability between the ages 65 and 75 in the United States with a correlation coefficient (R) of -0.418 and weighted average of 21.1%, a difference of 2.7%.
Disability Age 65 to 74 Correlation Summary
| Measurement | Immigrants from Egypt | Immigrants from Switzerland |
| Minimum | 2.4% | 3.7% |
| Maximum | 57.3% | 42.3% |
| Range | 54.9% | 38.6% |
| Mean | 21.5% | 16.0% |
| Median | 20.4% | 15.7% |
| Interquartile 25% (IQ1) | 18.0% | 8.5% |
| Interquartile 75% (IQ3) | 24.2% | 20.8% |
| Interquartile Range (IQR) | 6.2% | 12.4% |
| Standard Deviation (Sample) | 9.7% | 9.0% |
| Standard Deviation (Population) | 9.6% | 8.8% |
Similar Demographics by Disability Age 65 to 74
Demographics Similar to Immigrants from Egypt by Disability Age 65 to 74
In terms of disability age 65 to 74, the demographic groups most similar to Immigrants from Egypt are Chinese (21.7%, a difference of 0.0%), Immigrants from Belarus (21.7%, a difference of 0.060%), Immigrants from Hungary (21.7%, a difference of 0.070%), Immigrants from Scotland (21.7%, a difference of 0.13%), and Immigrants from South Africa (21.7%, a difference of 0.22%).
| Demographics | Rating | Rank | Disability Age 65 to 74 |
| Carpatho Rusyns | 99.5 /100 | #62 | Exceptional 21.6% |
| Immigrants | Europe | 99.4 /100 | #63 | Exceptional 21.6% |
| Immigrants | Latvia | 99.4 /100 | #64 | Exceptional 21.6% |
| Immigrants | Russia | 99.4 /100 | #65 | Exceptional 21.6% |
| Maltese | 99.4 /100 | #66 | Exceptional 21.6% |
| Immigrants | South Africa | 99.3 /100 | #67 | Exceptional 21.7% |
| Immigrants | Scotland | 99.3 /100 | #68 | Exceptional 21.7% |
| Immigrants | Egypt | 99.2 /100 | #69 | Exceptional 21.7% |
| Chinese | 99.2 /100 | #70 | Exceptional 21.7% |
| Immigrants | Belarus | 99.2 /100 | #71 | Exceptional 21.7% |
| Immigrants | Hungary | 99.2 /100 | #72 | Exceptional 21.7% |
| Immigrants | Venezuela | 99.0 /100 | #73 | Exceptional 21.8% |
| Cambodians | 99.0 /100 | #74 | Exceptional 21.8% |
| Mongolians | 99.0 /100 | #75 | Exceptional 21.8% |
| Greeks | 99.0 /100 | #76 | Exceptional 21.8% |
Demographics Similar to Immigrants from Switzerland by Disability Age 65 to 74
In terms of disability age 65 to 74, the demographic groups most similar to Immigrants from Switzerland are Israeli (21.2%, a difference of 0.11%), Russian (21.2%, a difference of 0.11%), Bulgarian (21.1%, a difference of 0.19%), Immigrants from Sri Lanka (21.1%, a difference of 0.25%), and Immigrants from Argentina (21.1%, a difference of 0.28%).
| Demographics | Rating | Rank | Disability Age 65 to 74 |
| Immigrants | Japan | 99.9 /100 | #29 | Exceptional 21.0% |
| Immigrants | Greece | 99.9 /100 | #30 | Exceptional 21.0% |
| Immigrants | Northern Europe | 99.9 /100 | #31 | Exceptional 21.0% |
| Turks | 99.9 /100 | #32 | Exceptional 21.0% |
| Immigrants | Argentina | 99.9 /100 | #33 | Exceptional 21.1% |
| Immigrants | Sri Lanka | 99.9 /100 | #34 | Exceptional 21.1% |
| Bulgarians | 99.9 /100 | #35 | Exceptional 21.1% |
| Immigrants | Switzerland | 99.8 /100 | #36 | Exceptional 21.1% |
| Israelis | 99.8 /100 | #37 | Exceptional 21.2% |
| Russians | 99.8 /100 | #38 | Exceptional 21.2% |
| Argentineans | 99.8 /100 | #39 | Exceptional 21.2% |
| Latvians | 99.8 /100 | #40 | Exceptional 21.2% |
| Immigrants | Austria | 99.8 /100 | #41 | Exceptional 21.2% |
| Macedonians | 99.7 /100 | #42 | Exceptional 21.3% |
| Immigrants | Croatia | 99.7 /100 | #43 | Exceptional 21.3% |